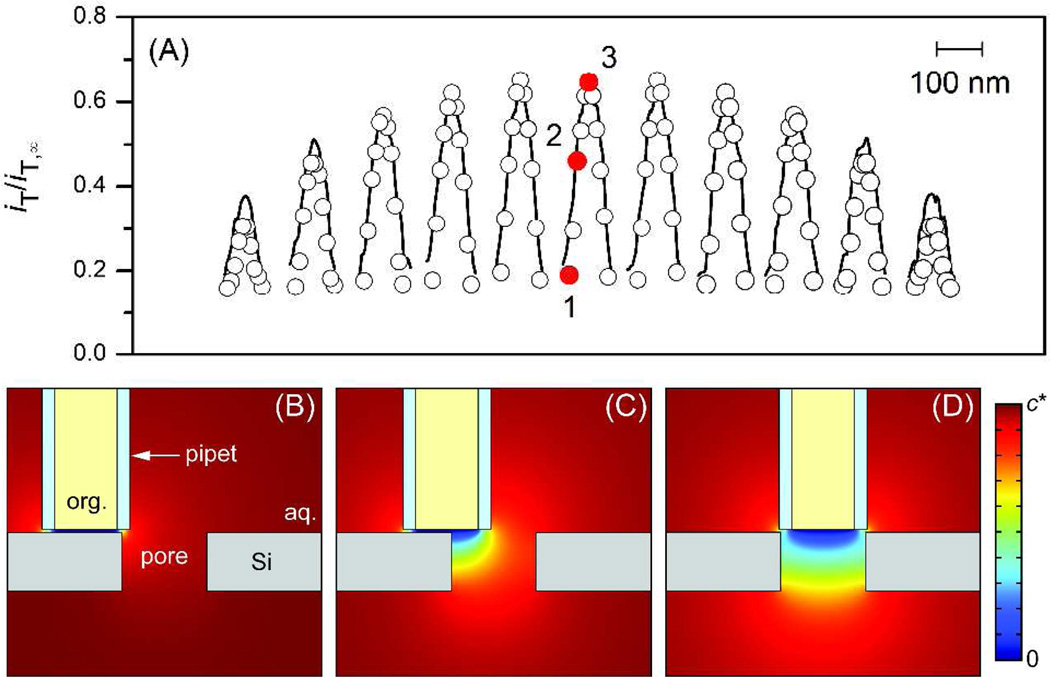
Figure 4.
(A) Simulated (circles) and experimental (solid lines) tip current, iT/iT,∞, in the normalized form for x-line scans over pore 7. In the simulation, the y position of the tip center was kept at Δy = −35, −25, −15, −10, −5, 0, +5, +10, +15, +25, and +35 nm from the leftmost peak to the rightmost peak, while its x position for each line scan was Δx = −42.5, −34, −25.5, −17, −8.5, 0, +8.5, +17, +25.5, +34, and +42.5 nm from the leftmost circle to the rightmost circle. Sliced concentration profiles are shown for tip positions at Δx = (B) −42.5, (C) −25.5, and (D) 0 nm and Δy = 0 nm, as indicated by red dots 1–3, respectively, in part (A).

