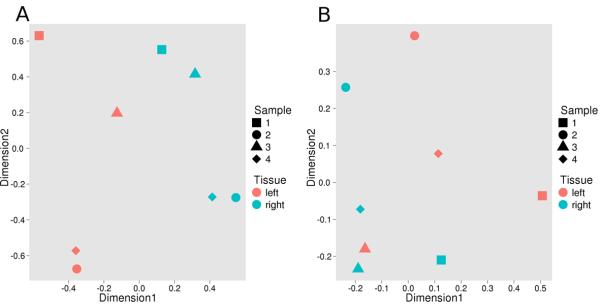
Figure 2.
Multidimension scaling (MDS) of gene expression differences between the left and right atria. A. MDS of the miRNA data reveals that the first dimension of miRNA expression imperfectly separated left (pink symbols) and right (blue symbols) atrial tissue, with the left atria tending to cluster on the left side of the plot. Different symbol shapes represent the four subjects, with sample 3 (triangle) representing the sinus rhythm donor. B. MDS of the mRNA data showing segregation of left and right atria in the first dimension.

