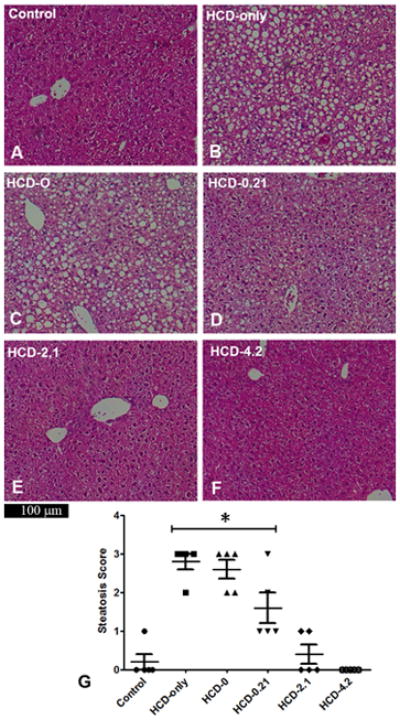
Figure 2. Liver histology and degree of hepatic steatosis after 19 days.

Hematoxylin and eosin stained liver sections of mice with different lipid supplementation. Liver sections from control mice showed normal hepatic architecture (A). HCD-only livers exhibited diffuse macro- and microvesicular steatosis in the periportal and midzone hepatocytes (B). HCD-0 livers were similar to HCD-only livers (C). HCD-0.21 livers showed a moderate reduction of steatosis in the periportal and midzone regions (D). HCD-2.1 and HCD-4.2 livers had well-preserved hepatic architecture with no focal microvacuoles (E–F). The results were reflected in the steatosis scores of these groups (G) in which mice in the HCD-only, HCD-0 and HCD-0.21 groups had higher median scores than control animals (*P<0.05). Data are expressed as median ± IQR. Group medians were compared using the Kruskal-Wallis test.
