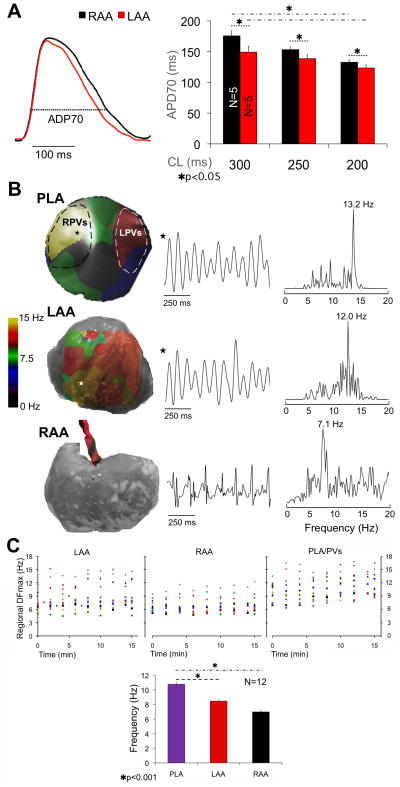
Figure 1.
A, left, single pixel AP from the LAA (red) and RAA (black). Right, APD70 at varying pacing CLs is shorter in LAA than RAA. APD70 significantly shortens in both appendages from 300 to 200 ms CL. B, left column, DF maps of the PLA and LAA, and electrode location on the RAA. Center column; single pixel activations (PLA, LAA) and bipolar electrograms (RAA). Right Column, power spectra showing DFmax at each location. C, top, LAA, RAA and PLA/PVs DFmax during 15 min of control AF. Bottom, bar graph of mean±SEM DFmax during control AF shows significant DF gradient between PLA and LAA/RAA.

