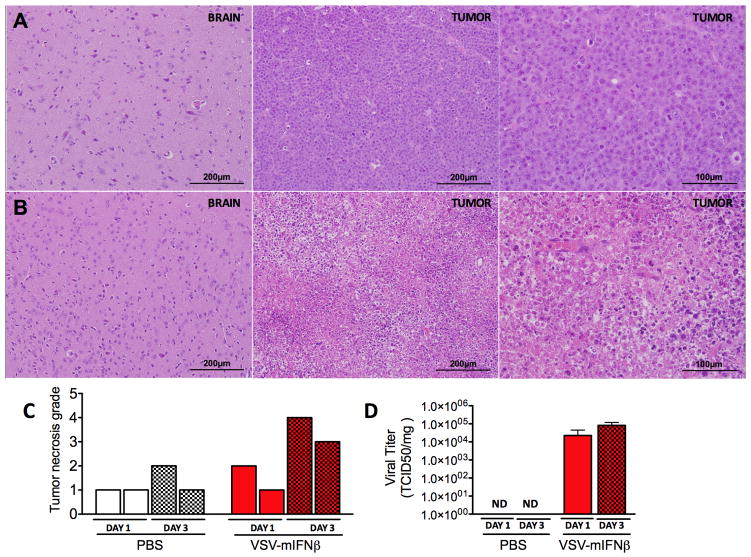
Figure 3. Tumor necrosis and virus recovery following systemic delivery of VSV-mIFNβ.
Representative appearance of brain and tumor tissues harvested from mice at day 3 post IV treatment with (A) PBS or (B) 1×10⁸ TCID50 VSV-mIFNβ. Tissues were harvested, paraffin-embedded and processed for H&E. Images are shown at 200x or 400x magnification (C) Quantification of tumor necrosis from H&E tumor sections from n=2 mice culled at day 1 (unshaded) or day 3 (shaded) following IV treatment with PBS (white) or VSV-mIFNβ (red). Degree of necrosis was measured using 4-point scale 1: <25% tissue necrosis 2: 25–50 tissue necrosis, 3: 50–75% tissue necrosis, 4: >75% tissue necrosis. (D) Viral load in tumor harvested at day 1 (unshaded) and day 3 (shaded) post IV PBS or VSV-mIFNβ treatment. Tumor specific viral load was measured by maceration of tumors and measurement of viral titer in supernatant of tumor suspensions. Results are plotted as viral titer per mg of tissue.

