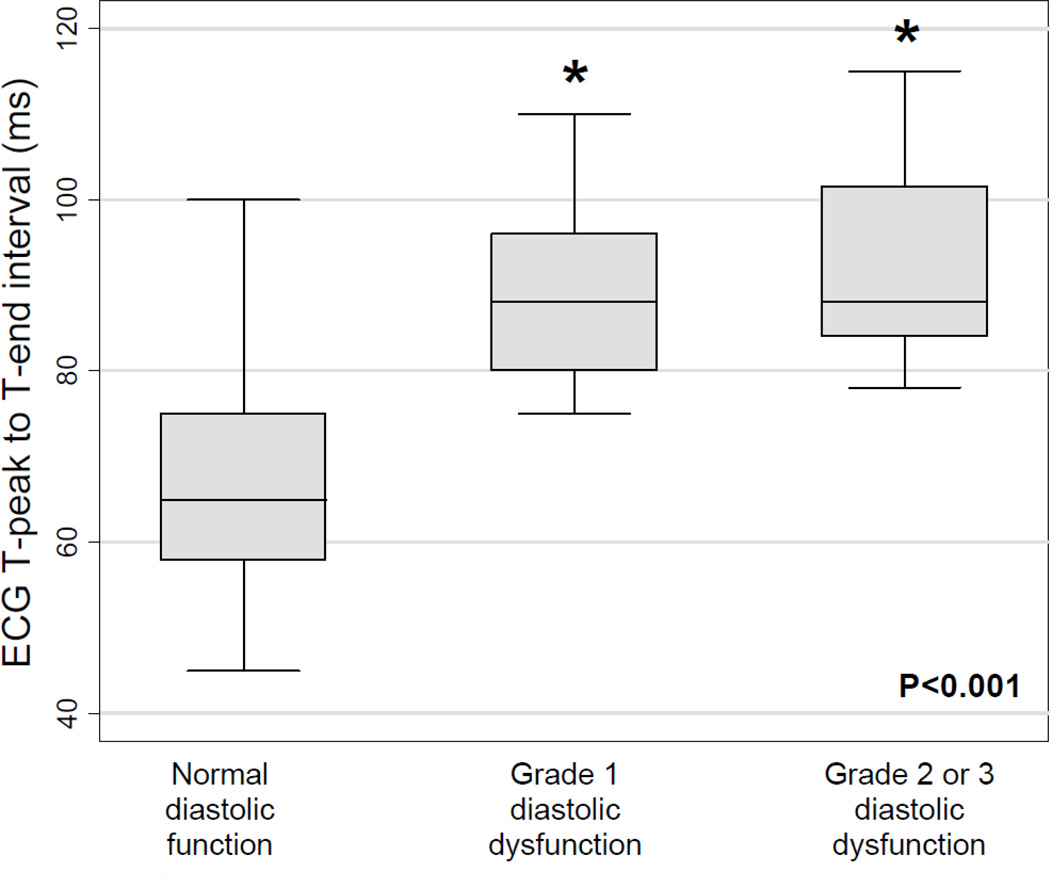
Figure 3.
Box-and-whisker plot of T-peak to T-end interval versus left ventricular diastolic dysfunction grade. P-value across all 3 groups calculated using one-way analysis of variance. Individual diastolic dysfunction groups were compared to normal diastolic function using t tests. Asterisk denotes P<0.0001 for comparison versus normal diastolic function group.

