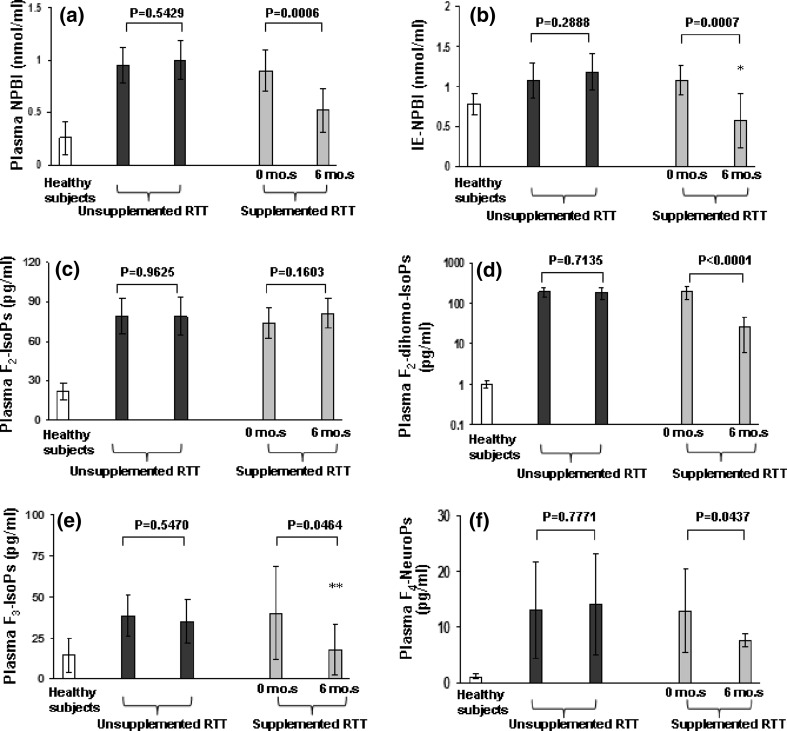
Fig. 2.
Nonprotein bound iron and isoprostanes levels changes following 6-month ω-3 PUFAs supplementation in stage I RTT patients. Plasma F2-dihomo-IsoP values (mean ± SE) are presented in logarithmic scale. Legend P-NPBI, plasma NPBI; IE-NPBI, intra-erythrocyte NPBI; mo.s, months. All the differences between treated RTT (before and after), untreated RTT (time 0 and time 6 months), and healthy controls were statistically significant. *P = 0.10 versus healthy controls; **P = 0.567 versus healthy controls

