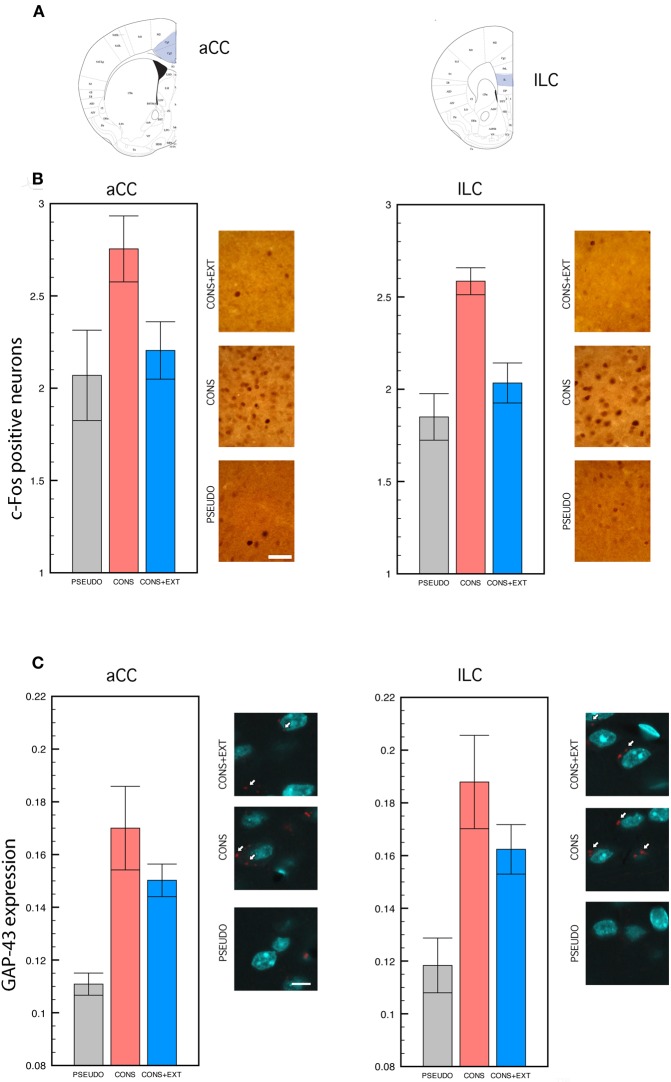
Figure 2.
c-Fos immunocytochemistry and GAP-43 immunofluorescence. Statistical comparisons were performed on the raw data. (A) Anatomical delimitation of anterior cingulate (aCC) and infra-limbic (ILC) cortices based on Franklin and Paxinos (2001). (B) c-Fos positive cells counted in the aCC and the ILC of PSEUDO, CONS, and CONS + EXT mice after remote memory testing. In both regions, c-Fos positive cells were significantly more numerous in the CONS group than in the PSEUDO and the CONS + EXT groups among which no difference was found [significant group effect: (F(2, 32) = 10.88, P < 0.001), CONS vs. PSEUDO or CONS + EXT, P < 0.001 for each pair comparison; non-significant ROI effect: (F(1, 32) = 2.04, P = 0.16); non-significant ROI × group interaction: (F(2, 32) = 0.01, P = 0.98)]. Scale bar: 50 μm. (C) Densitometric analyses of GAP-43 signal in individual neurons labeled with NeuN after remote memory testing. The GAP-43 signal values were significantly lower in the PSEUDO group than in the CONS and the CONS + EXT group among which no difference was found [group effect: (F(2, 30) = 15.67, P = 0.001), PSEUDO vs. CONS or CONS + EXT, P < 0.001 for each pair comparison; ROI effect: (F(1, 30) = 1.72, P = 0.19); ROI × group interaction: (F(2, 30) = 0.09, P = 0.90)]. Scale bar: 10 μm. White arrows indicate the GAP-43 immunofluorescent labeling.

