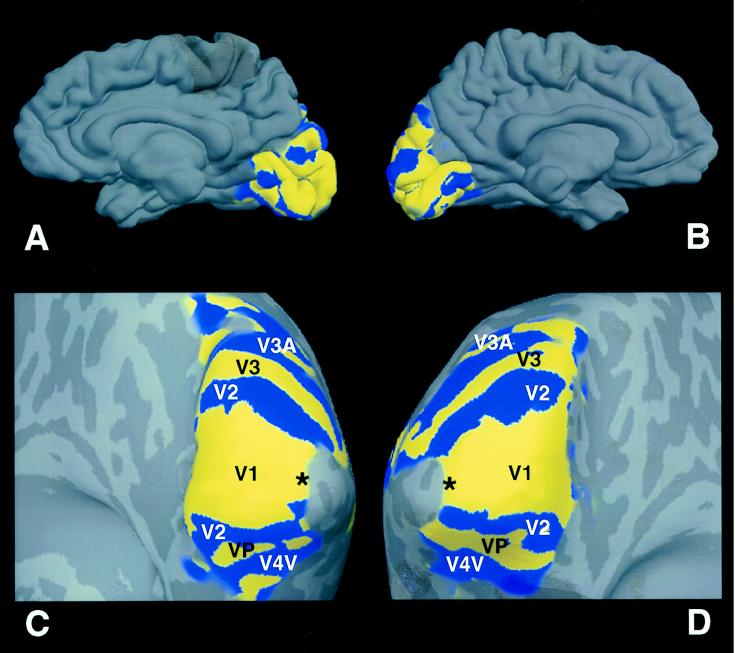
Figure 1.
Topography of primary visual cortex and surrounding areas. (A and B) Field sign analysis (12, 13) of retinotopic cortical visual areas from right and left hemispheres (respectively) in a single subject. Both hemispheres are views of the medial bank, in its normal, folded configuration. Thus in A, anterior is to the left, and posterior to the right. In B, this is reversed. The field sign maps are based on two scans measuring polar angle (rotating thin ray stimulus), and two scans measuring eccentricity (expanding thin ring stimulus), acquired from echo-planar images in a 3-T scanner (General Electric/ANMR), using a bilateral, send/receive quadrature coil. Both stimuli extended 18–25° in eccentricity (36–50° extent). (C and D) Same data, in a cortically “inflated” format, now viewed from a more posterior–inferior vantage point. Again the left panel shows the right hemisphere, and the right panel shows the left hemisphere from the same subject. Human retinotopic areas revealed by the field sign analysis have been labeled (V1, V2, V3, VP, V3A, V4v). Cortical areas with a visual field sign (polarity) similar to that in the actual visual field are coded blue, and those areas showing a mirror-reversed field polarity are coded yellow. Also labeled is the foveal representation in V1 (black asterisks). Gyri and sulci in the folded state (e.g., A and B) are coded in lighter and darker shades of gray (respectively) in the inflated format (C and D). In this subject, area V1 is somewhat larger than normal, extending well past the lips of the calcarine fissure. However, as in most subjects, the V1 representation of the extrafoveal horizontal meridian lies near the fundus of the calcarine fissure.

