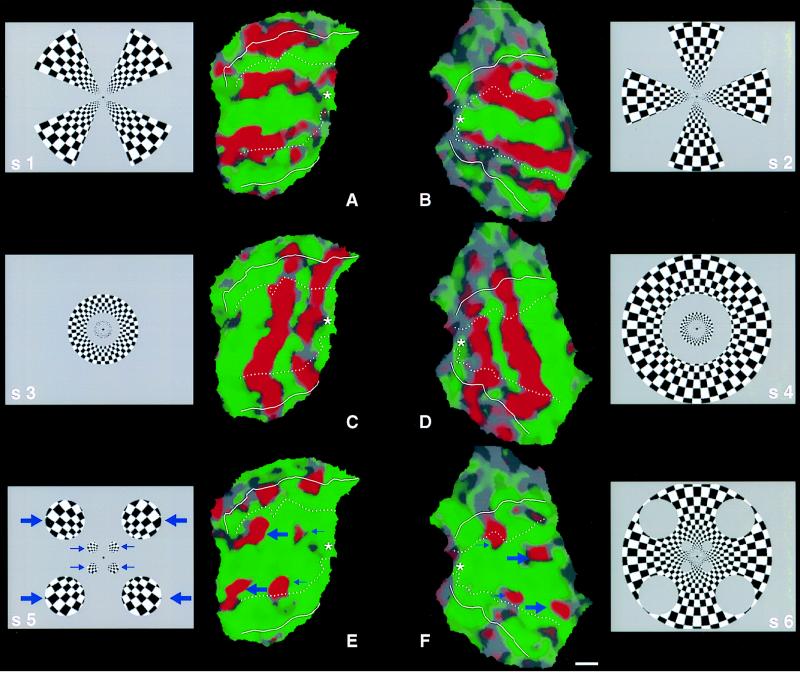
Figure 2.
Representation of stationary polar coordinate stimuli (rays and rings, respectively) in human V1. This experiment was designed to produce a “bulls-eye” or “spider web” pattern in area V1 and examine the response by using fMRI, analogous to the pattern produced in macaque V1 previously by using different functional imaging techniques (34, 35). Here, the ray and ring stimuli were presented separately, during different scan acquisitions. During the first scan, the subjects viewed alternating 16-sec epochs of ray stimuli (“S1” and “S2”) composed of flickering black and white checks. This viewing produced the activity patterns shown in A and B. Preferential activation by the first stimulus is coded in red, and preferential activation by the second stimulus is coded green. A is a flattened section of the cortical surface from the right hemisphere, and B is from the left hemisphere. Both sections are taken from the same hemisphere shown in Fig. 1. Area V1 is the large middle region enclosed in dotted lines (i.e., the representation of the vertical meridian, based on the field sign map). V1 is flanked on both sides by V2, then V3/VP. The foveal representation is represented by a white asterisk. As one would expect from previous retinotopic maps in macaques and humans, rays of equal polar angle produce bands of approximately equal width in flattened cortex. During the second scan, the stimuli were composed of interleaved rings, again composed of flickering black and white checks (“S3” and “S4”). The rings were of equal polar width, thus quite unequal in width in the visual display. This stimulus produced activity bands of approximately equal width in cortex (C and D, same red–green pseudocolor conventions), oriented roughly at right angles to the bands of equal-polar-angle in A and B. During the third scan, stimuli were circular in shape (S5 and S6). The diameters of the stimulus circles were equal in polar coordinates. Thus the circles were much larger in angular subtense at greater eccentricities (large blue arrows), compared with the circles at more central eccentricities (smaller blue arrows). Nevertheless, the roughly circular activity representation of the two sets of circles in V1 was approximately equal in cortical extent (E and F). The stimulus circles are rerepresented, but progressively more faintly, in V2 and V3/VP. [The scale bar represents 1 cm (on average) across the cortical surface.]

