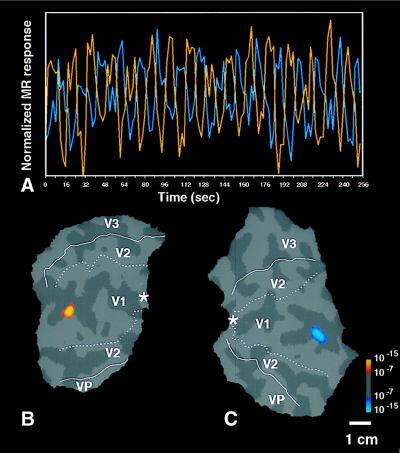
Figure 4.
Functional labeling of the representation of the retinal “blind spot,” as a monocular region in V1. B and C show flattened cortical surfaces including the central two-thirds of V1, V2, and V3/VP from both left and right hemispheres (B and C, respectively) from the same subject shown in Figs. 1 and 2. During the associated experiment, the subject viewed a large stimulus composed of flickering checks, using alternating monocular stimulation in alternating 16-sec epochs. Relative to nonstimulated baseline, the stimulus produced robust activation across all of these cortical surfaces (not shown). Preferential activation by right vs. left eye is coded in red–orange vs. blue–cyan, respectively. The data are accumulated from one 4 min and 16 sec scan with a 3-T scanner. The high field strength is partly why the significance levels (f test; see statistical logo at lower right) are relatively high. The foveal representation is marked by an asterisk, and the area borders revealed by the field sign maps (Fig. 1) are transposed onto the flattened maps, as in Fig. 2. The time course of the activity in these two “blind spot” representations is shown in A (orange for right eye, cyan for left eye stimulation); the mutual alternation of magnetic resonance (MR) signals is quite clear. Differential activation of similar-sized stimulus “circles” in the visual field produces resolvable activation in both V1 and V2 (Fig. 2 E and F). Thus it is interesting that the representation of the blind spot does not show up in V2 (B and C), in the same subject. However, no attempt was made to equate activity thresholds across these two experiments.

