Figure 2.
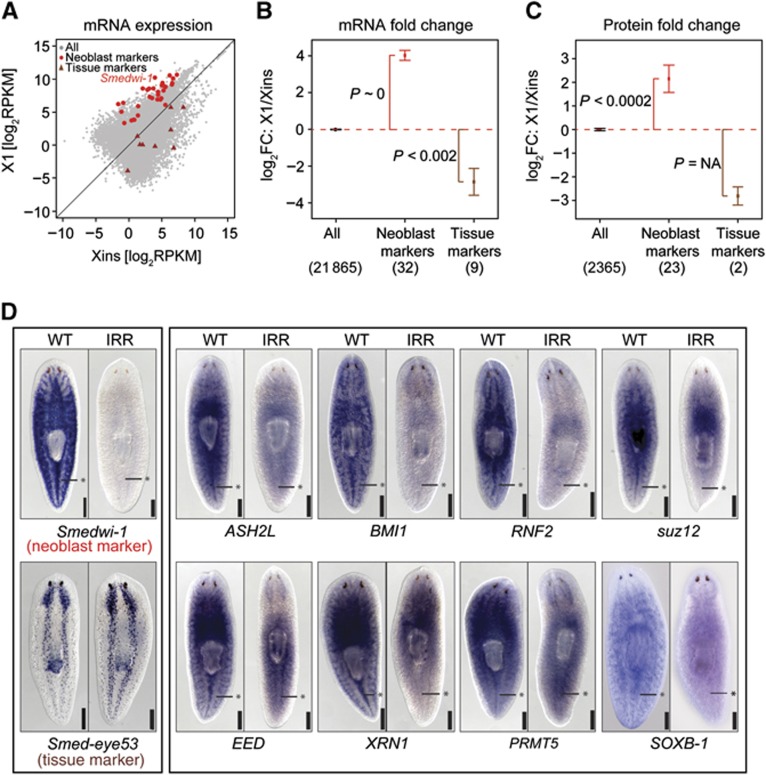
Validation of transcript and protein quantification and identification of neoblast-specific genes. (A) Comparison of transcript expression in X1 and Xins. Neoblast markers (red dots) and tissue markers (brown triangles) are highlighted. (B, C) Average fold changes (FC) of transcripts (B) and proteins (C) for neoblast and tissue markers. Error bars represent the standard error of the mean. The number of genes is shown in parentheses. Enrichment of upregulated or downregulated genes (P) was assessed by Fisher’s exact test. (D) Validation of neoblast enrichment by ISH. Asterisks mark the midline posterior to the pharynx where neoblasts are concentrated. ISH for the known neoblast marker Smedwi-1 and the nervous system marker Smed-eye53 were used as controls.

