Figure 8.
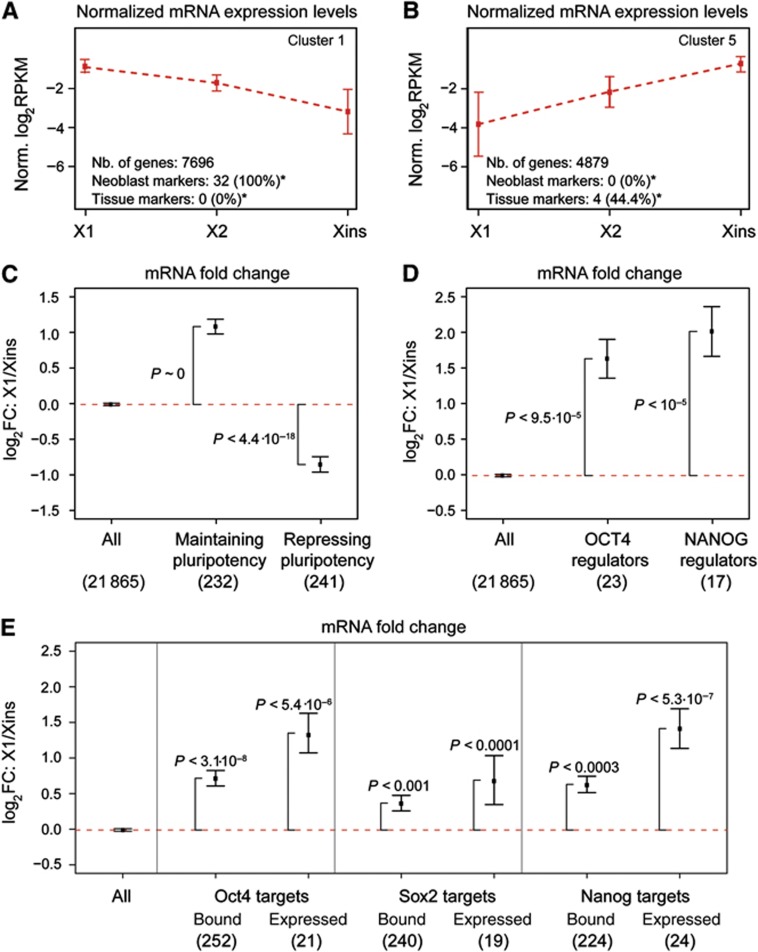
Homologues of mammalian pluripotency genes are enriched in the neoblast transcriptome. (A, B) Two of the six transcript expression clusters. Cluster 1 (A) contains genes with enhanced neoblast expression and cluster 5 (B) contains genes upregulated in differentiated cells. Average expression (broken red line) and standard deviation (error bars) are shown. (C–E) Average transcript fold changes between X1 and Xins for homologues of (C) mouse genes required for maintenance and repression of pluripotency, (D) human regulators of OCT4 and NANOG expression in ESCs and (E) Oct4, Nanog, and Sox2 targets in mouse ESCs. In (E), data are shown for all targets (Bound), and for the subset of targets upregulated in pluripotent versus differentiated cells (Expressed). In (C–E), error bars represent the standard error of the mean. Enrichment of upregulated or downregulated genes (P) was assessed by Fisher’s exact test. The number of mammalian genes with planarian homologues is shown in parentheses. *P<0.05 (Fisher’s exact test).

