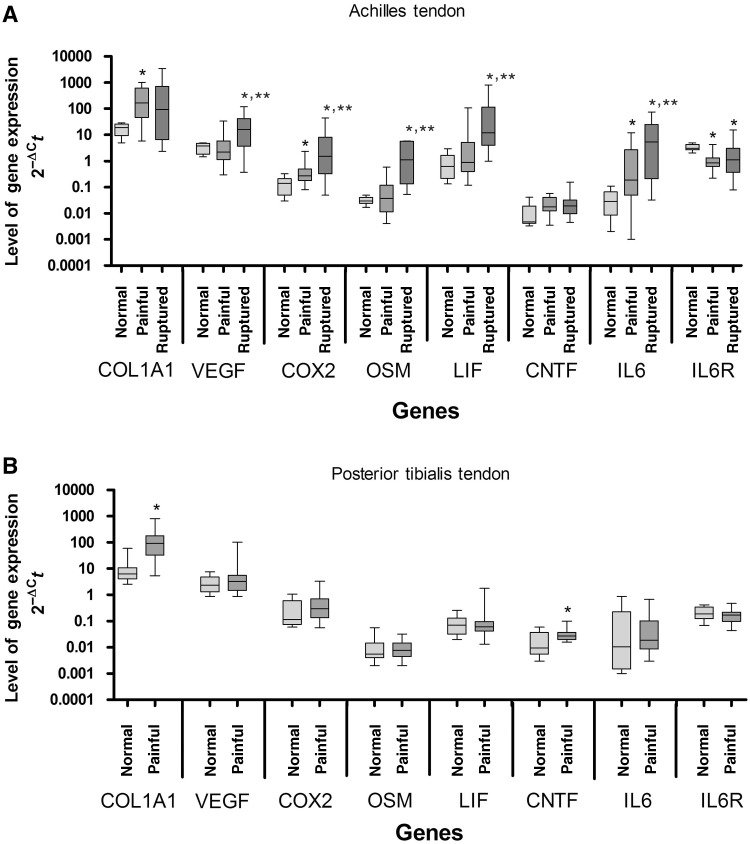
Fig. 1.
Expression of mRNA in (A) normal, painful and ruptured AT and (B) normal and painful PTT. Values are normalized to the mean of EIF4A2 and topo-1. Data are presented as box-and-whisker plots. The median is represented by the line within the box, while the box extends from the 25th to the 75th percentile. The whiskers show the highest and lowest values. *Significantly different from control specimens; **significant difference between painful and ruptured specimens (P ≤ 0.05; Mann–Whitney U-test).

