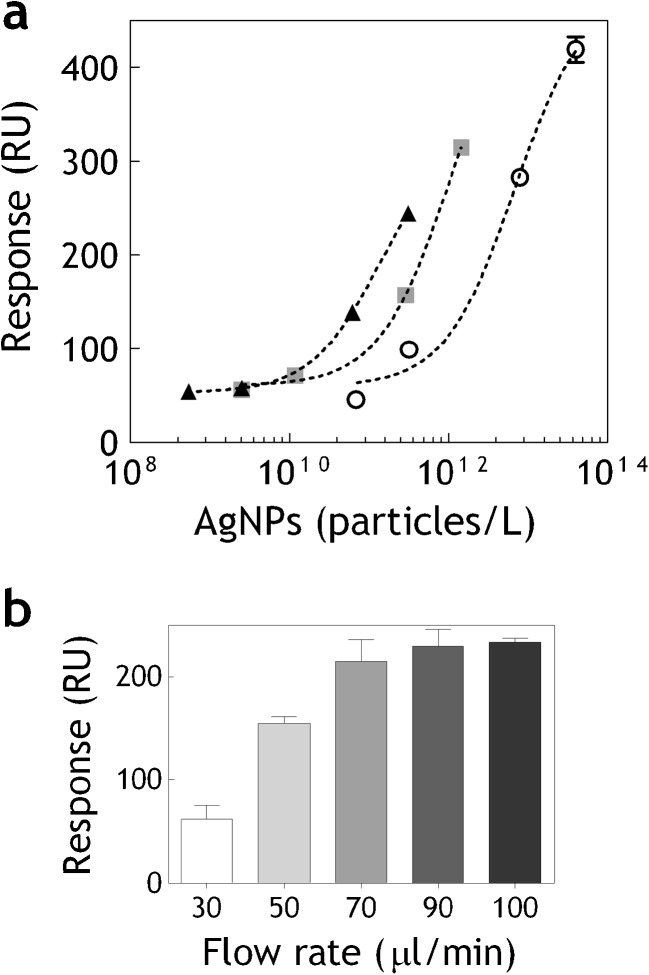
Fig. 4.
a Dose response curves measured on hMT1A-coated flow channel with different sizes of BioPure NanoComposix AgNPs—20 nm (open circles), 60 nm (gray squares), 100 nm (black triangles). Error bars show standard deviations between three independent experiments. b Maximal binding responses (RU) measured on hMT1A coated flow channel with 110 nm BioPure NanoComposix AgNPs at different flow rates (in microliters per minute)

