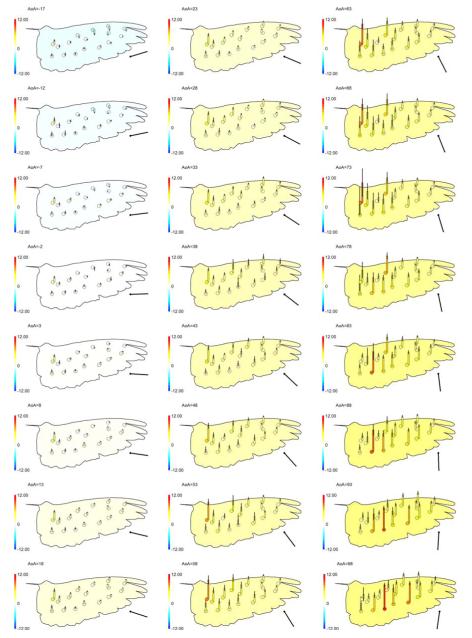
Fig. 4.
Coefficients of pressure CP from point pressure measurements, and for the whole wing derived from forceplate measurements (background colours). Black vertical bars show ±6 SD of the pressure-derived signals. The scale bars to the left relate pressure coefficients to both colour and column (and error bar) height

