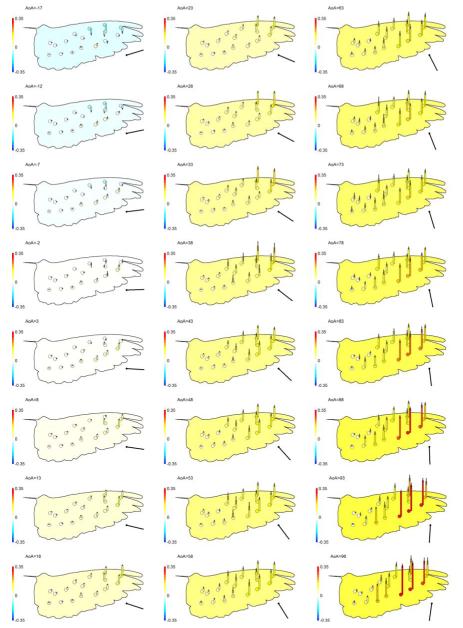
Fig. 5.
Point (kp) and whole wing (Kp, background wing colours) differential pressures normalised by air density and the square of angular velocity, but not (unlike the coefficients in Fig. 4) by distance from the centre of rotation. Therefore, values show true relative magnitudes: larger differential pressures occur at the (faster moving) wingtip. Black vertical bars show ±6 SD of the pressure-derived signals. The scale bars to the left relate pressure coefficients to both colour and column (and error bar) height

