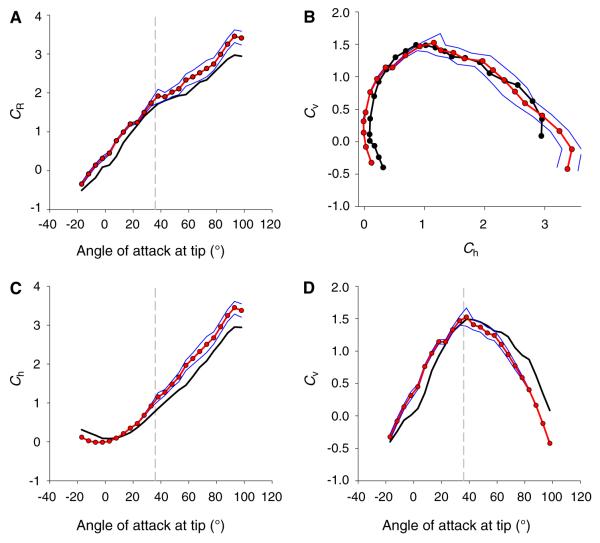
Fig. 6.
Force coefficients derived from forceplate measurements (bold black), and differential pressure measurements (red), using averages of all the pressure measurements for each section, and assuming the resultant aerodynamic force acts perpendicular to each wing chord. Blue lines bounding the pressure-derived values show coefficients derived with ±2 SD of the measured pressure signals. The vertical dashed lines indicate the angle at which stall is postulated

