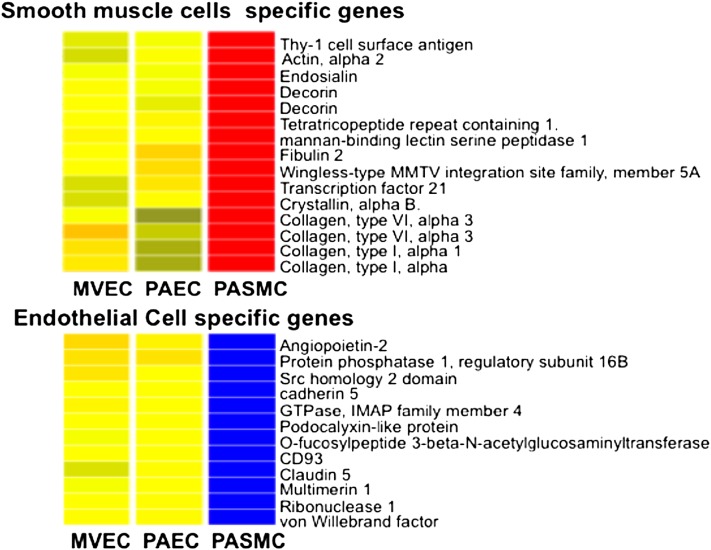
Figure 8.
Gene expression analysis. Hierarchical clustering of gene expression array data from PAECs (n = 14), MVECs (n = 5), and pulmonary artery smooth muscle cells (PASMCs) (n = 4) demonstrates that PAECs and MVECs have closely related gene expression signatures but are distinctly different from PASMCs. Color coding denotes relative gene expression on a continuous scale from blue (lowest expression), through yellow (similar expression levels) to red (highest).

