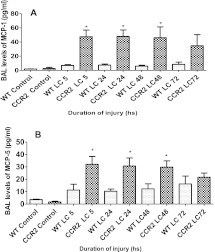
Figure 11.
Levels of CCL-2 and macrophage chemoattractant protein (MCP)-5 were higher in the CCR2−/−mice compared with WT mice after LC. The chemokines, CCL-2 (MCP-1) (Figure 5A) and MCP-5 (Figure 5B), were measured in the BAL of WT and CCR2−/− mice at 5, 24, 48, and 72 hours after LC by ELISA, as described in Materials and Methods. Values are presented as means (±SEM; n = 14). Each experiment was repeated at least three times with four to five animals per group. Statistical analysis was performed on data at each time point, and samples were analyzed using the two-tailed unpaired t test with Welch's correction. *P < 0.05 compared with corresponding WT.

