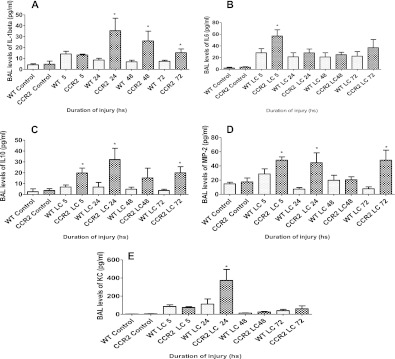
Figure 6.
CCR2−/− mice showed a marked increase in cytokine response compared with WT after LC. IL1 β (A), IL-6 (B), IL10 (C), macrophage inflammatory protein-2 (D), and keratinocyte chemoattractant (E) levels in the BAL of WT and CCR2−/− mice were analyzed by ELISA at 5, 24, 48, and 72 hours after injury (mean ± SEM; n = 14). Statistical analysis was performed on data at each time point, and intergroup comparisons were made with two-tailed unpaired t test with Welch's correction. *P < 0.05 compared with corresponding WT.

