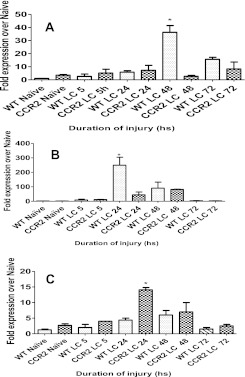
Figure 9.
Activation of M2 macrophages is observed more in the WT mice after LC. Quantitative TaqMan PCR analysis of Arg1 (A), FIZZ1 (B), and nitric oxide synthase (NOS)-2 (C) transcript expression in the WT and CCR2−/− mice after 5, 24, 48, and 72 hours of LC, were performed. Data are means (±SEM) from BAL macrophages cultured from five mice at each time point. Statistical analysis was performed on data at each time point using one-way ANOVA. *P < 0.05 compared with corresponding WT.

