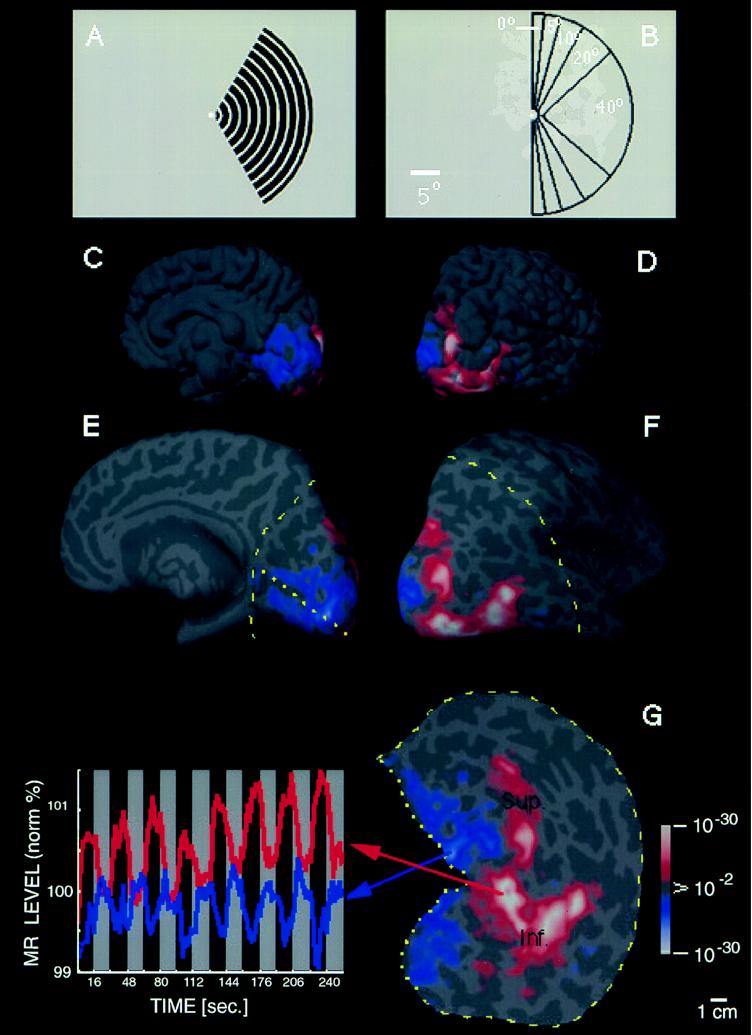
Figure 1.
Unilateral stimuli used in these experiments (A and B) and the topography of MR activity produced by one of these stimuli in the ipsilateral hemisphere (C–G). (A) A representative stimulus: a moving (7°/sec), rectangular wave radial grating (0.5 cycles/degree, duty cycle = 0.2), confined to a fixed sector on either the right (as in A) or left side of a fixation point. (B) A diagram of the full range of sector sizes used: in different scans, stimuli spared the vertical meridian by either 0°, 5°, 10°, 20°, or 40° of polar angle. The stimulus in A spares the vertical meridian by 20° of polar angle. Calibration bar = 5° of visual angle. (C–G) Cortical activity produced in a representative ipsilateral hemisphere (subject AL) by the stimulus in A. Activity is shown in different views, including the normal, folded cortex (C and D), and in an “inflated” cortical format (E and F) that shows activity normally hidden in cortical sulci. C and E are taken from a posterior-medial viewpoint, and D and F are taken from a posterior-lateral viewpoint. The ipsilateral activation and anatomical topography is more fully revealed in flattened cortical format (G), including posterior (visual) cortex. The arbitrary cut lines in the cortical surface are indicated by yellow lines (E–G: dotted = cut along the calcarine fissure; dashed = cut along the lateral surface). The pseudocolor scale bar indicates the statistical significance of the fMRI activity, based on an f-test. Increased MR signals in phase with grating presentation (i.e., conventional fMRI activity) range from a display threshold of P > 0.01 (red) to a maximum of P > 10−30 (white, surrounded by red). Regions of decreased MR signal during grating presentation are coded with an inverted color scale, from P > 0.01 (blue) to P > 10−30 (white, surrounded by blue). Maximum significance levels are relatively high partly because the data represents an average of eight identical scans (16,384 images total). The scale bar represents 1 cm (uncorrected for distortion) in the flattened image (G), 8 mm (E and F), and 6.7 mm (C and D). Although no stimulus appeared in the visual hemifield contralateral to this hemisphere at any time, there was significant positive fMRI activity (coded in red through white) in a bifurcating pattern on the lateral surface of the ipsilateral hemisphere (D, F, and G). From a common origin just lateral to the posterior pole, the superior branch (sup.) extends toward the superior terminus of the parieto-occipital fissure, and the inferior branch (inf.) runs antero-posteriorly along the inferior lateral surface. The ipsilateral stimulus also produces weaker, but statistically significant, decreases in MR level (blue through white) in the medial bank, where V1, V2, and other retinotopically specific areas are known to be located (refs. 23–31; see also Figs. 3 and 4). In corresponding regions of the contralateral hemisphere (see Fig. 2B), this unilateral stimulus produces robust increases in cortical activity, consistent with the known contralateral retinotopy. These activity maps were clarified by displaying the time course of MR changes from two regions of interest in this hemisphere. In the graph (Lower Left), the interhemispheric stimuli were presented during 16-sec epochs (black stripes), separated by epochs of stimulation with a uniform gray field (gray stripes). One time course is taken from the region showing the bifurcating MR-positive (red-white) responses during presentation of the interhemispheric stimuli (region indicated with red arrow). The other time course is taken from those regions (primarily in the medial bank) that show MR-negative changes (blue-white, indicated by blue arrow) during presentation of the interhemispheric stimuli, relative to intervening, uniform gray control stimuli.

