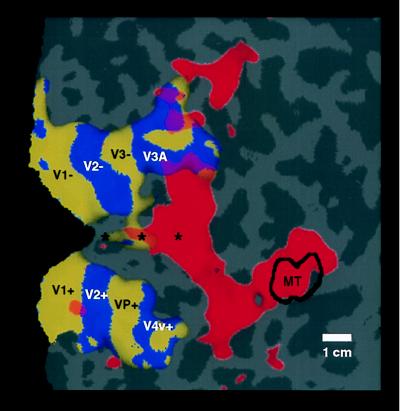
Figure 3.
Topographical relationship between cortical areas manifesting contralateral (classical) retinotopy, compared with regions showing ipsilateral activity. Both patterns were produced and are displayed in the right hemisphere (subject LK). The ipsilateral activity (shown in red) was produced by the stimulus in Fig. 1A. The contralateral activity (yellow and blue) was produced by “thin” rings and rays, as described elsewhere (24). Regions showing significant contralateral retinotopy with polarity similar to that in the visual field are shown in yellow, and regions showing significant mirror-symmetric contralateral retinotopy are shown in blue. Other flattened format conventions are as described in accompanying figures.

