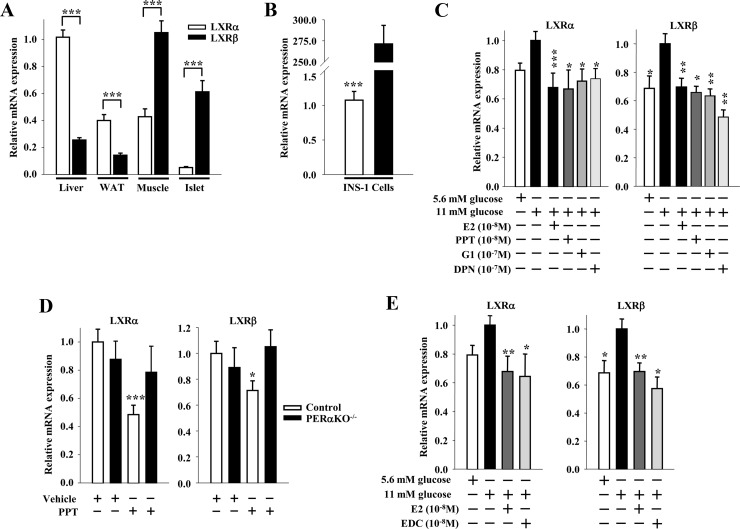
Fig. 5.
ER suppress LXR mRNA expression in β-cells. A, LXRα and -β gene expression normalized to β-actin in mouse liver, white adipose tissue (WAT), skeletal muscle, and islets (n = 12–18 mice). B, LXRα and β gene expression normalized to β-actin in INS-1 cells (n = at least 3 experiments). C, Effects of E2 (10−8 m), PPT (10−8 m), G1 (10−7 m), and DPN (10−8 m) treatments (4 h) on LXRα and -β gene expression normalized to β-actin in INS-1 cells cultured under lipogenic conditions (11 mm glucose without FFA) (n = at least 3 experiments). D, LXRα and -β gene expression normalized to β-actin in islets of male control and PERαKO−/− mice treated with PPT (200 μg/d for 2 d) (n = 8–24 mice). E, Effects of E2 (10−8 m) and EDC (10−8 m) treatments (4 h) on LXRα and -β gene expression normalized to β-actin in INS-1 cells cultured under lipogenic conditions (n = at least 3 experiments). Results represent mean ± se. *, **, or ***, vs. control vehicle or 11 mm glucose when not indicated. *, P < 0.05; **, P < 0.01; ***, P < 0.001.

