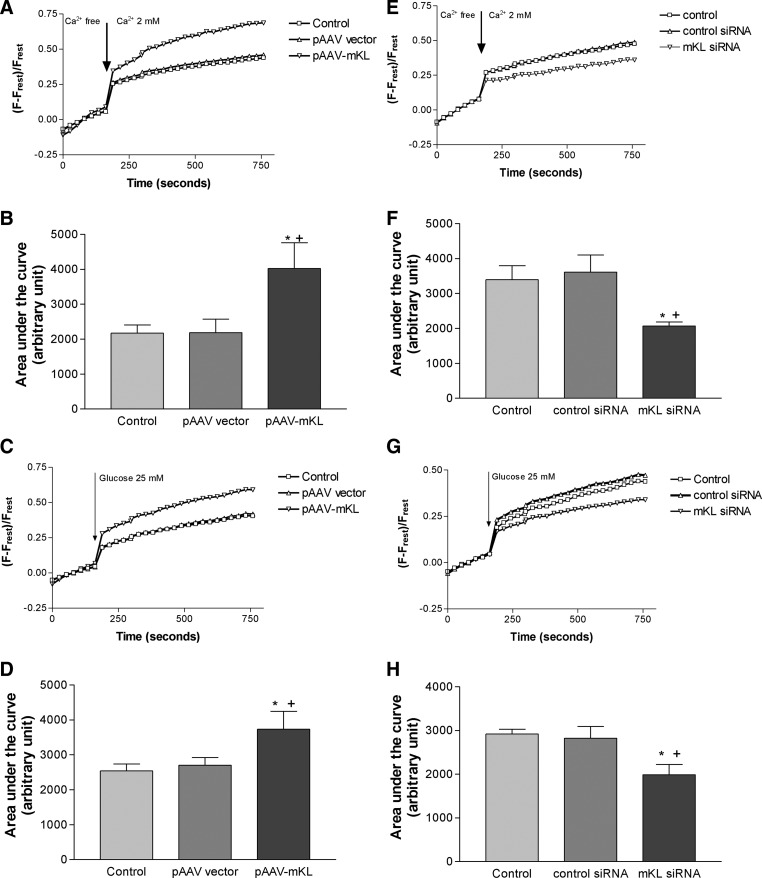
Fig. 6.
Klotho regulated calcium entry and glucose-induced intracellular calcium responses. MIN6 cells were transfected with pAAV-mKL, mKL siRNA, or vehicles for 72 h and then seeded on a 96-well plate overnight. A, Average of calcium entry in cells with overexpression of mouse Klotho. [Ca2+]c change in calcium orange-loaded MIN6 cells was monitored for 3 min in calcium-free KRB and then measured for an additional 10 min after cells were challenged with 2 mm Ca2+. B, Quantification of calcium entry by measuring area under the curve of calcium entry in cells with overexpression of mouse Klotho (n = 4–5). C, Average of glucose-induced intracellular calcium changes in cells with overespression of mouse Klotho. [Ca2+]c change in calcium orange-loaded MIN6 cells was monitored for 3 min in KRB and then measured for an additional 10 min after cells were challenged with 25 mm glucose. D, Quantification of calcium entry by measuring area under the curve of glucose-induced calcium changes in cells with overexpression of mouse Klotho (n = 4–5). pAAV vector rather than pAAV-GFP was used to avoid interference of green fluorescence with calcium orange fluorescence. Data are means ± sem. *, P < 0.05 vs. the control group (transfection reagent alone); +, P < 0.05 vs. the pAAV vector group. E, Average of calcium entry in cells with knockdown of mouse Klotho. [Ca2+]c change was monitored as described in A. F, Quantification of calcium entry by measuring area under the curve of calcium entry in cells with knockdown of Klotho (n = 4–6). G, Average of glucose-induced intracellular calcium changes in cells with the knockdown of mouse Klotho. [Ca2+]c change was monitored as described in C. H, Quantification of calcium entry by measuring the area under the curve of glucose-induced calcium changes in cells with knockdown of Klotho (n = 4–5). Data are means ± sem. *, P < 0.05 vs. the control group (transfection reagent alone); +, P < 0.05 vs. the control siRNA group.

