Fig. 7.
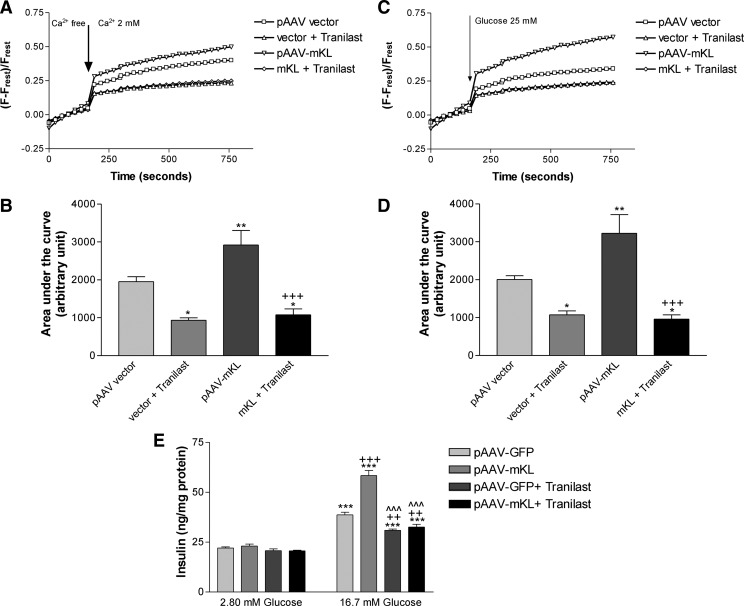
Inhibition of TRPV2 by Tranilast abolished the promoting effects of overexpression of mouse Klotho on calcium entry and glucose-induced calcium responses and insulin secretion. MIN6 cells were transfected with pAAV-mKL or vehicles for 72 h and then seeded on a 96-well plate overnight. A, Average of calcium entry in cells. [Ca2+]c change in calcium orange-loaded MIN6 cells was monitored for 3 min in calcium-free KRB and then measured for an additional 10 min after 2 mm Ca2+ and/or 75 μm Tranilast was added. B, Quantification of calcium entry by measuring area under the curve of calcium entry (n = 4–5). Data are means ± sem. *, P < 0.05, **, P < 0.01 vs. the control group (pAAV vector); +++, P < 0.001 vs. the pAAV-mKL group. C, Average of glucose-induced intracellular calcium change. [Ca2+]c change in calcium orange-loaded MIN6 cells was monitored for 3 min in KRB and then measured for an additional 10 min after 25 mm glucose and/or 75 μm Tranilast was added. D, Quantification of calcium entry by measuring area under the curve of glucose-induced intracellular calcium change (n = 4–5). Data are means ± sem. *, P < 0.05, **, P < 0.01 vs. the control group (pAAV vector); +++, P < 0.001 vs. the pAAV-mKL group. E, Effects of Tranilast on the promoting effects of Klotho on glucose-induced insulin secretion. Insulin secretion was measured in the medium as described in Fig. 2D after treatments with glucose and/or Tranilast. Data are means ± sem (n = 3). ***, P < 0.001 vs. the control group (pAAV-GFP) with the concentration of glucose at 2.8 mm; ++, P < 0.01, +++, P < 0.001 vs. the control group (pAAV-GFP) with the concentration of glucose at 16.7 mm; ^^^, P < 0.001 vs. the pAAV-mKL group with the concentration of glucose at 16.7 mm.

