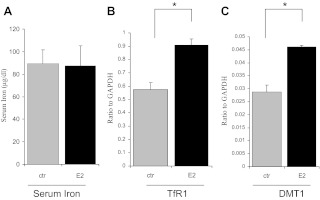
Fig. 6.
Alteration of body iron homeostasis in vivo by E2. WT mice (n = 6) were treated with E2 as described in the legend of Fig. 5. After killing at 24 h, blood samples were collected for measurements of serum iron (A) by ferrozine assay. Bone marrow samples were isolated from tibia and femora and used for qPCR analyses of TfR1 (B) and DMT-1 (C). Data were presented as means ± sd *, Significantly different from the untreated controls (ctr).

