
Figure 1.
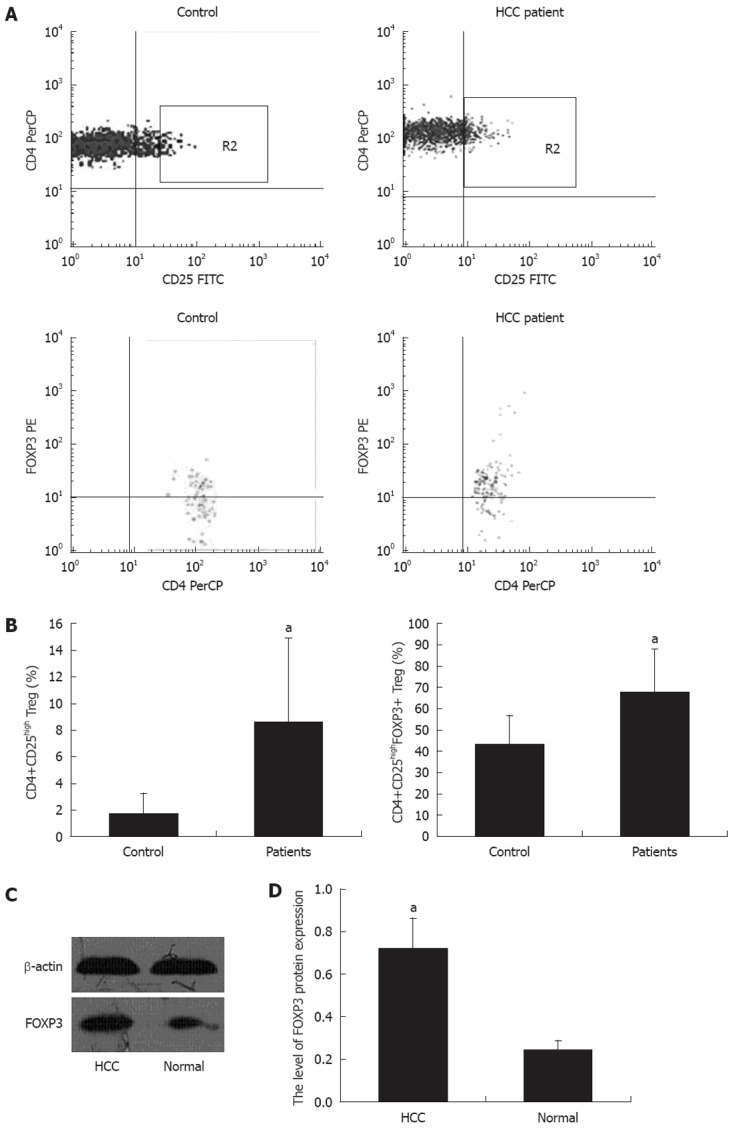
CD4+CD25highFOXP3+ regulatory T cells accumulation in hepatocellular carcinoma and peripheral blood. A: Representative flow cytometry plots of CD4+CD25high regulatory T cell (Treg) (region R2) and family of transcription factor P3 (FOXP3)+ Treg cells in peripheral blood from a healthy donor and hepatocellular carcinoma (HCC) patient; B: Percentage of CD4+CD25high Treg and FOXP3+ Treg cells in peripheral blood from HCC patients and controls; C: The prevalence of CD4+CD25high Treg (8.57% ± 6.31%, P = 0.002) and FOXP3+ Treg cells (67.51% ± 20.59%, P < 0.05) in peripheral blood from HCC patients was significantly higher than that of healthy donors (1.71% ± 1.59% and 43.35% ± 13.91%, respectively). Western blotting analysis of nuclear extracts prepared from HCC and normal tissues; D: The relative expression of FOXP3 protein (FOXP3 protein/β-actin protein × 100%). The FOXP3 protein expression in HCC tissues was stronger (0.72 ± 0.14) as compared with normal tissues (0.24 ± 0.05) (aP < 0.05). FITC: Fluorescein isothiocyanate.