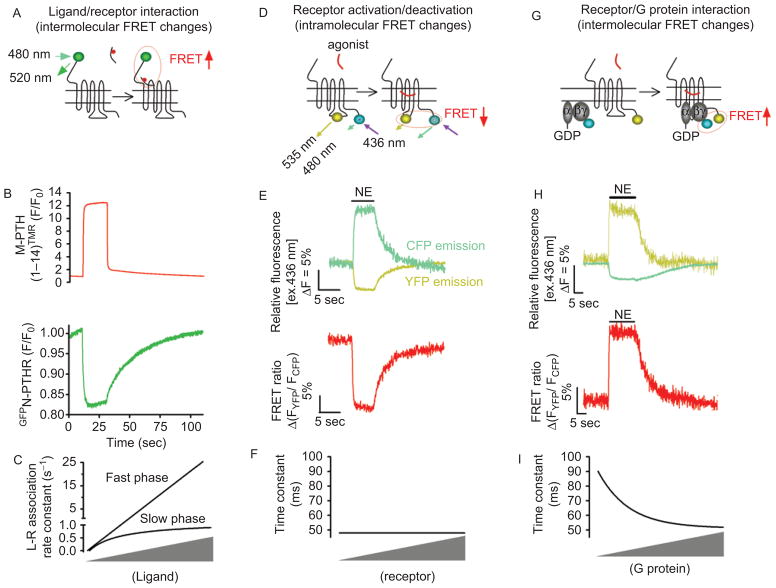
Figure 1.
Application of Förster resonance energy transfer (FRET) for recording initial steps of G protein-coupled receptors (GPCR) signaling in live cells. (A) Kinetics of ligand/receptor interaction are measured under a fluorescence microscope where a single cell was selectively excited at 480 nm [excitation of green fluorescent protein (GFP)], and the changes of the GFP emission fluorescence (515 nm) caused by FRET between a receptor N-terminally labeled by GFP (•) and a tetramethylrhodamine (TMR•)-tagged ligand were recorded over time. (B) Example of ligand/receptor interaction measured by FRET between GFP-tagged PTH-receptor (GFPN-PTHR) and TMR-labeled PTH analog, M-PTH(1–14)TMR. Shown are the changes of GFP emission by FRET (green signal) in response to rapid superfusion of a PTH analog, M-PTH(1–14)TMR (red signal). (C) Relationship between the rate constants k (s−1) and ligand concentration. k values for the first component (k fast) are directly proportional to the ligand concentration, whereas k values for the second step (k slow) follow an hyperbolic dependence on ligand concentration and reach a maximal value. (D) For receptor activation/deactivation, experiments are performed under a fluorescence microscope, where light at 436 nm selectively excited a single cell expressing GPCRFlAsH/CFP or GPCRCFP/YFP (for recordings of receptor activation) to induce donor (CFP•) and acceptor (FlAsH or yellow•) emission fluorescences simultaneously recorded over time. FRET is calculated as the ratio of emission intensities FYFP/FCFP after correction for the donor bleed-through into the acceptor emission, the direct acceptor excitation by light at 436 nm, and photobleaching effect. (E) Example of FRET experiments showing direct recordings of norepinephrine (NE)-mediated activation of α2AARFlAsH/CFP in a single HEK-293 cell. Activation of α2AAR is monitored upon NE application (horizontal bar) by a decrease in the FRET signal (red). (F) Relationship between the time constant of α2A-ARFlAsH/CFP activation after stimulation by NE at a saturating concentration, and receptor concentrations. (G) Receptor/G protein interactions are measured by recording the time course of FRET between a GPCR C-terminally labeled by yellow fluorescent protein and a CFP-labeled Gγ in combination with Gα and Gβ subunits. The principal of these experiments are similar than those described in Figure 1D. (H) Example of recordings showing the interaction between α2AAR and Gi proteins in response to NE measured as an increase in FRET between YFP-labeled α2AAR and CFP-labeled Gγ2 in combination with Gαi1 and Gβ1 proteins. (I) Relationship between the time constant of α2A-ARCFP/Gαi1b1g2YFP interaction after stimulation by NE (100 mM) and G protein concentrations. In this case the kinetics of receptor/G protein interaction depend on expression levels of Gi. (Adapted from ref (20,23,24).) FlAsH, Fluorescein Arsenical Hairpin binder; PTHR, parathyroid hormone type 1 receptor.

