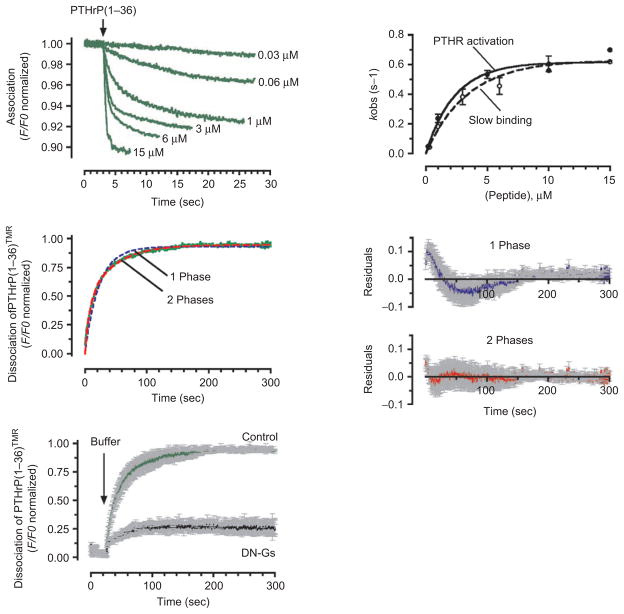
Figure 2.
Kinetics of association and dissociation. (A) Association time courses of PTHrP(1–36)TMR to GFPN-PTHR are represented by the decrease in the green fluorescent protein (GFP) fluorescence emission. Measurements were recorded in a single HEK-293 cell stably expressing GFPN-PTHR with various concentrations of PTHrP(1–36)TMR (left panel). Slow rate constants, kobs values (mean ± SEM), obtained from fitting the time course of binding with the sum of two exponential components, followed a hyperbolic dependence on ligand concentrations that coincides those of PTHR activation (right panel). (B) Comparing fits of a one-(blue dashed line) and a two-exponential component (red dashed line) model for the time course of PTHrP(1–36)TMR release (green line). The corresponding of averaged residuals (differences between the experimental data and calculated fitted curves) are plotted in the right panels and indicated that the two-exponential component curve fits the data more accurately. Grey bars represent SD. (C) Averaged dissociation time courses of PTHrP(1–36)TMR from the GFPN-PTHR are shown in the absence or presence of a dominant negative Gαs (DN-GS). Förster resonance energy transfer recordings are shown as normalized ratios. Grey bars represent the SEM. The black arrow indicates the time of ligand wash out. (Adapted from refs (24).) PTHR, parathyroid hormone type 1 receptor.

