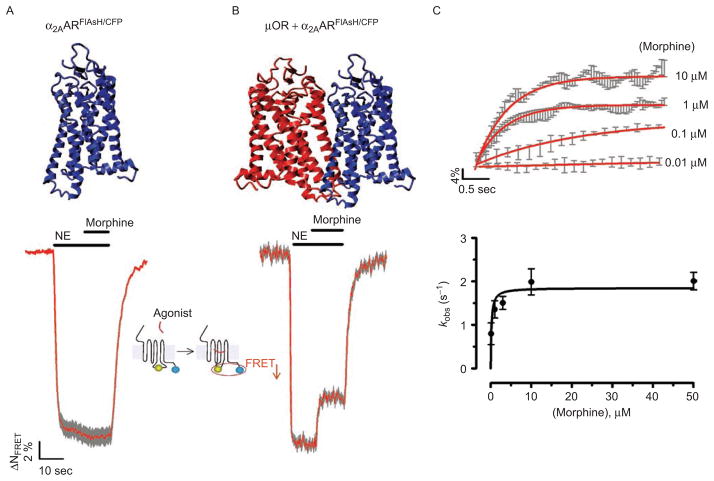
Figure 4.
Trans-conformational switching of the α2AAR by the μOR as an allosteric mechanism underlying direct inhibition of receptor activation. (A) and (B) Time-resolved changes of the Förster resonance energy transfer (FRET) ratio in a single HEK-293 cell expressing the α2AARFlAsH/CFP (left panels) or co-expressing α2AARFlAsH/CFP and μOR (A). The red trace represents normalized FRET signals and grey bars represent SD. Horizontal bars indicate the application of norepinephrine (NE) or morphine to the cell. (C) The top panel represents the averaged inhibition of NE (50 μM)-mediated α2AARFlAsH/CFP activation by different concentrations of morphine on cells co-expressing α2AARFlAsH/CF and μOR (from data similar to those in Figure 4B). The lower panel represents the relationship between the apparent rate constant kobs of inhibition of NE (50 μM)-mediated receptor activation and morphine concentrations. kobs values were obtained from fitting the averaged kinetic data from the top panel to a monoexponential equation. (Adapted from ref (36).) FlAsH, Fluorescein Arsenical Hairpin binder.

