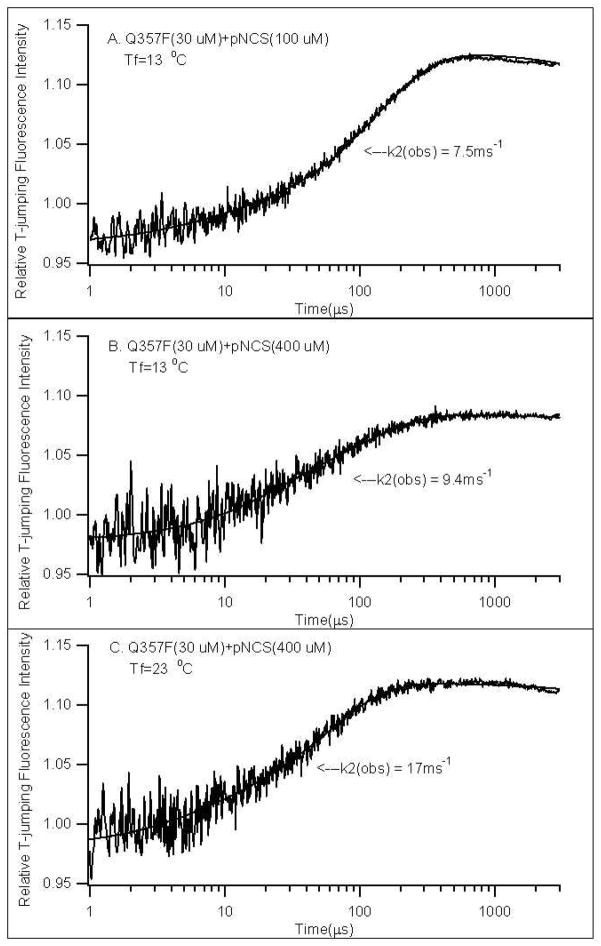
Figure 6.
Typical T-jump fluorescence relaxation profiles of YopH at different concentrations of pNCS and final temperatures. All samples were in 0.050 M Citrate buffer with 0.10 M NaCl, pH 6.5. Curve fitting results with two-exponential functions (Equation 2) are also shown.

