
Fig. 11.
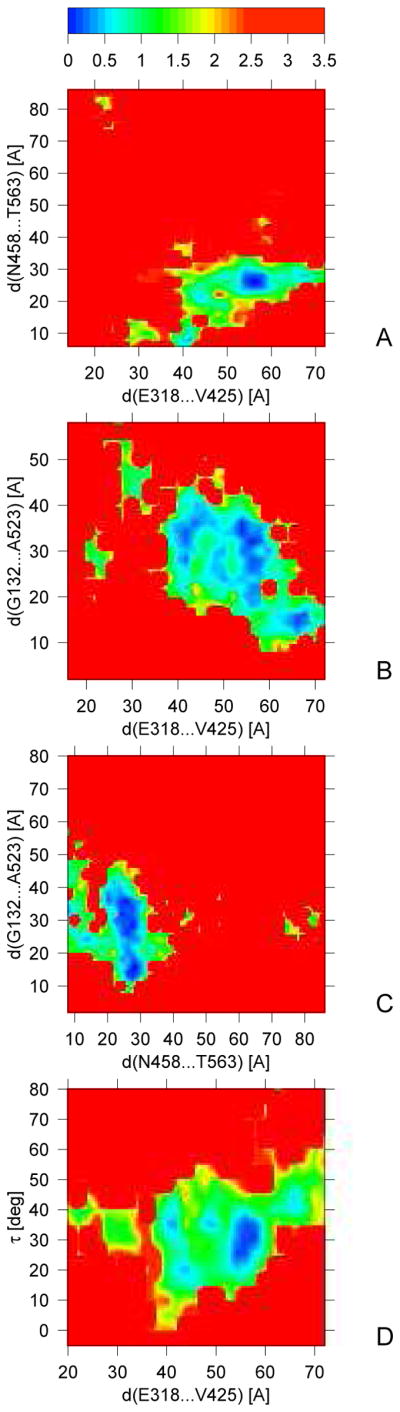
Sections of the free-energy surface of 2KHO in pairs of selected conformational descriptors at T = 300 K obtained from MREMD simulations. The color scale for energy (in kcal/mol) is shown in the upper panel.
Official websites use .gov
A
.gov website belongs to an official
government organization in the United States.
Secure .gov websites use HTTPS
A lock (
) or https:// means you've safely
connected to the .gov website. Share sensitive
information only on official, secure websites.
Sections of the free-energy surface of 2KHO in pairs of selected conformational descriptors at T = 300 K obtained from MREMD simulations. The color scale for energy (in kcal/mol) is shown in the upper panel.