
Figure 4. Colonic microbiota in GF mice and Ex−GF mice.
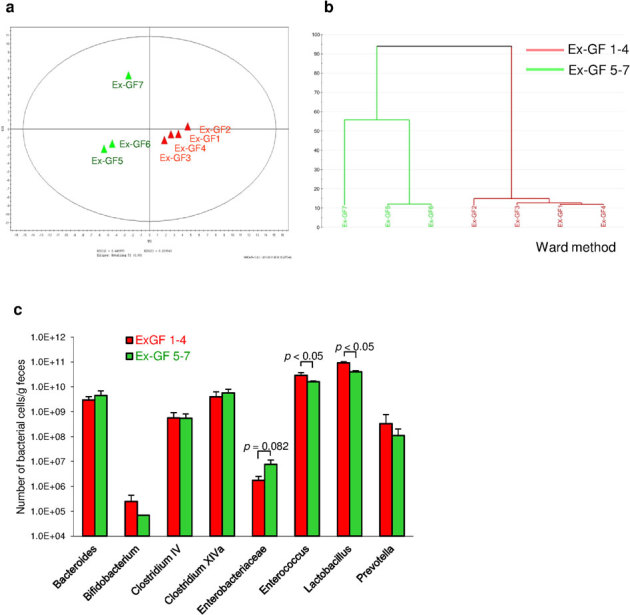
(a) PCA of the profiling data from colonic microbiota. (b) The dendrogram of the T-RFLP profiles of colonic microbiota from GF mice and Ex-GF mice. (c) The number of predominant bacterial genera and groups in the Ex-GF 1, 2, 3, and 4 (first sons) and Ex-GF 5, 6, and 7 (second sons) clusters.