. 2012 Jun 15;17(10):101506. doi: 10.1117/1.JBO.17.10.101506

Fig. 4.

Fig. 4

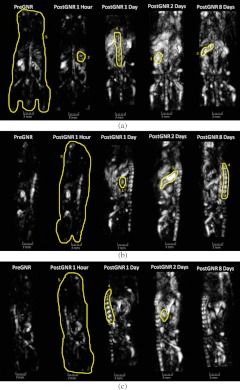
Three-dimensional OA volumes reconstructed from a mouse before and after intravenous injection of OA contrast agent based on the GNR-PEG solution. (a) Dorsoventral, (b) left medio-lateral, and (c) right medio-lateral views. 1064 nm laser illumination. The locations of the image areas used for analysis of organ-specific changes on each view are outlined: 1—left kidney, 2—right kidney, 3—spleen, 4—spine, 5—whole body. Starting from pre-injection (Video 2) to post-injection after two days (Video 4), there is a visible increase in contrast. (Video 2, QuickTime, 1.68 MB) [URL: http://dx.doi.org/10.1117/1.JBO.17.10.101506.2]; (Video 4, QuickTime, 1.71 MB). [URL: http://dx.doi.org/10.1117/1.JBO.17.10.101506.4].