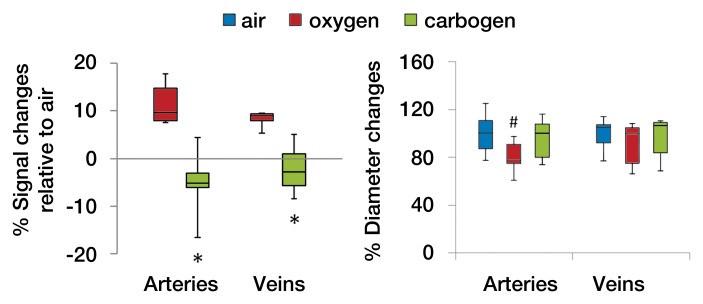
Figure 6c:
MR angiographic images (26/4.3) of the retinal vascular layer during gas challenges with 30 mg of iron per kilogram MION injection. (a) Images show flattened vascular structures during air, oxygen, and carbogen inhalation. Data were from the same subject as shown in Figure 4. (b) Graphs show linearized vessel profiles during air, oxygen, and carbogen inhalation. Insets: Flattened MR images of the retinal vascular layer show the analyzed segment. (c) Graphs show vessel diameter and signal intensity changes in the retinal vessels associated with gas challenges (n = 6). * = P < .05, significantly different from oxygen inhalation. # = P < .025, significantly different from air inhalation.

