
Figure 5e:
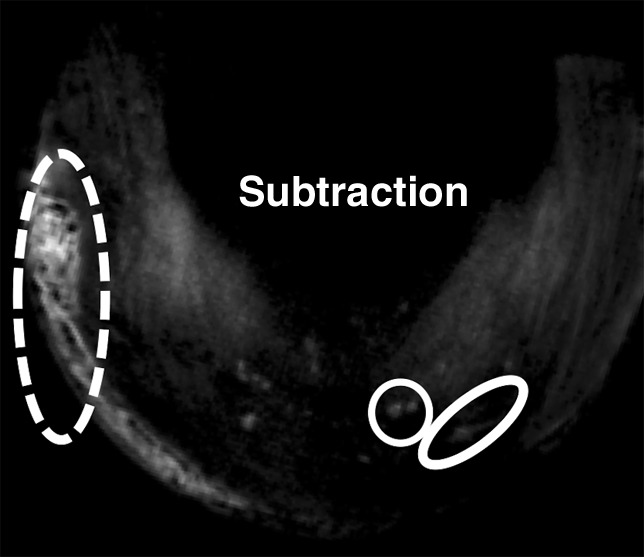
Morphologic evaluation of meniscal calcifications. (a) Axial radiograph (Rx), considered the reference standard, with which (b) axial 3D FSPGR and (c–e) axial 3D UTE MR images were correlated. Punctate (circles), linear (ovals), and globular (dashed ovals) calcifications are visible with all sequences. The calcifications show the same morphology and spatial arrangement as on a. They appear hypointense on b and hyperintense on e. Note that the signal from the calcifications decreases between the two echoes of the UTE sequences (c and d) because of their short T2* value. Also note that the areas surrounding the calcifications have lost their normal fibrillar pattern on b and d. TE = echo time.