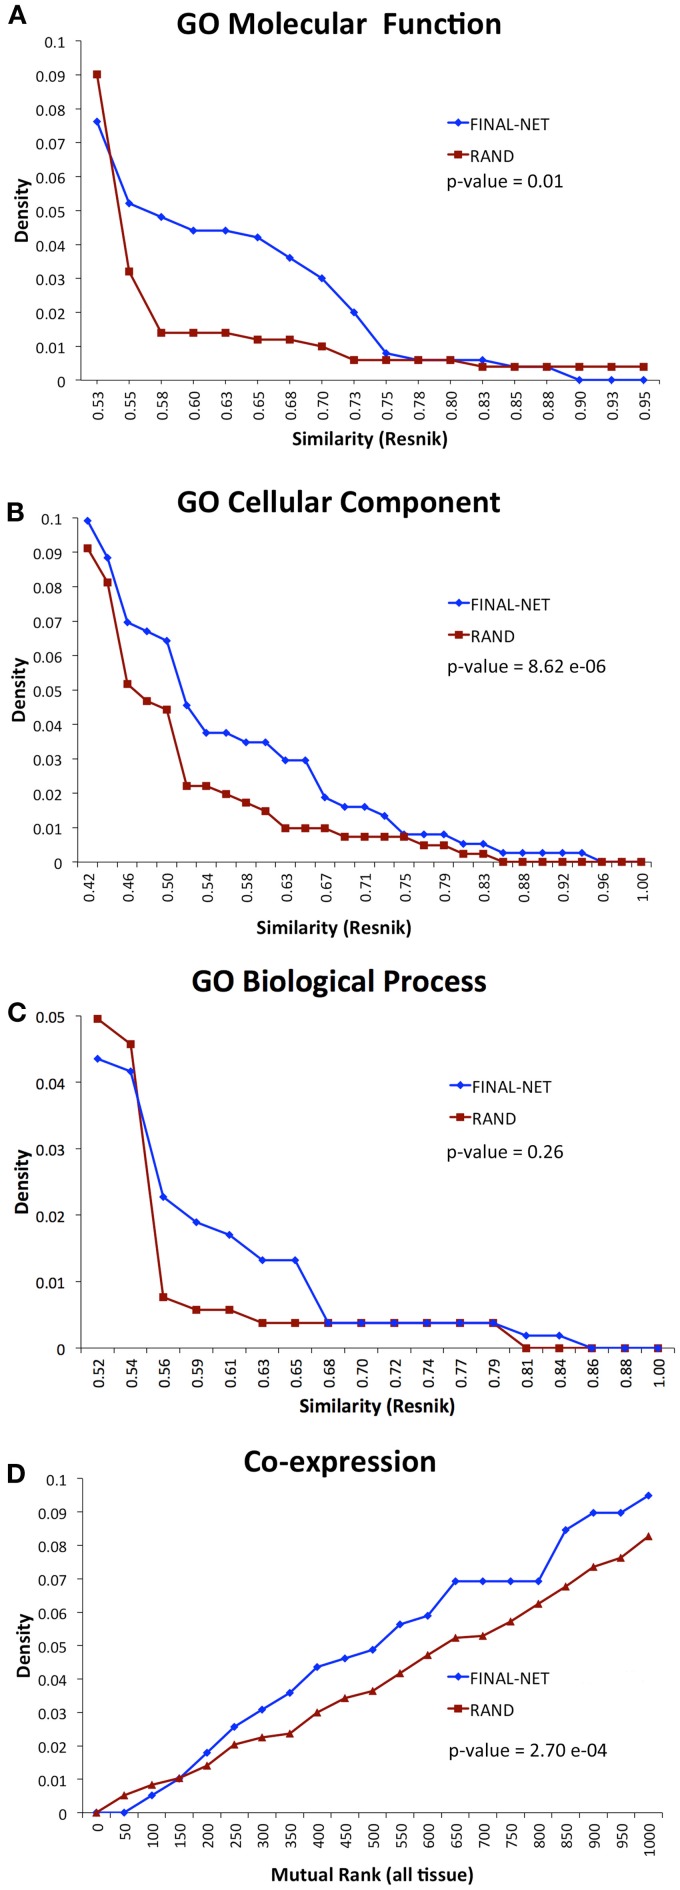
Figure 3.
Functional similarity distribution of interaction pairs in our final network compared to an average of 100 randomized networks with the Resnik method (Resnik, 1995) by using GO molecular function annotations (A), GO cellular component annotations (B), GO biological process annotations (C), and gene co-expression from ATTED II (Obayashi et al., 2009) (D).

