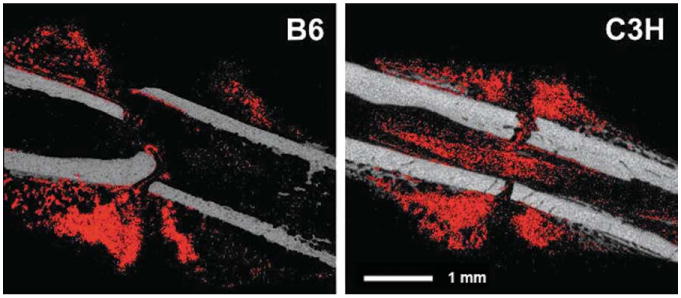
Fig. 2.

Representative, sagittal cross-sections of B6 and C3H fracture calluses: the pre-incubation image is shown in grey and the binarized subtracted image (regions identified as cartilage) is overlaid in red. [Color figure can be viewed in the online issue, which is available at wileyonlinelibrary.com.]
