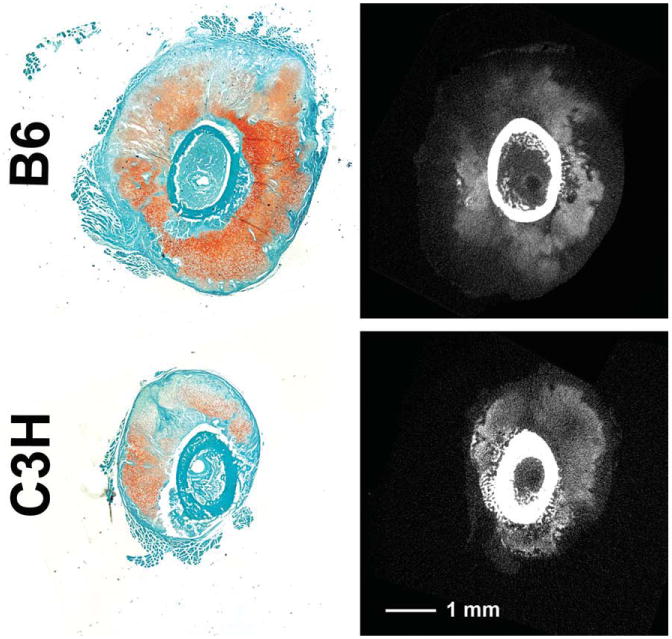
Fig. 4.

Histology of POD10 fracture calluses from a previous study (Jepsen et al., 2008) is compared to post-incubation tomograms. The histological sections (left column) were stained with Fast Green and Safranin-O, the latter coloring areas with higher GAG concentrations a darker red. In the tomograms (right column), regions of higher concentrations of GAGs would be expected to be those that are light gray (cortex and other mineralized tissue appear as white or nearly white). The presence of the contrast agent also enables clear visualization of the boundaries of the soft callus. [Color figure can be viewed in the online issue, which is available at wileyonlinelibrary.com.]
