
Fig. 6.
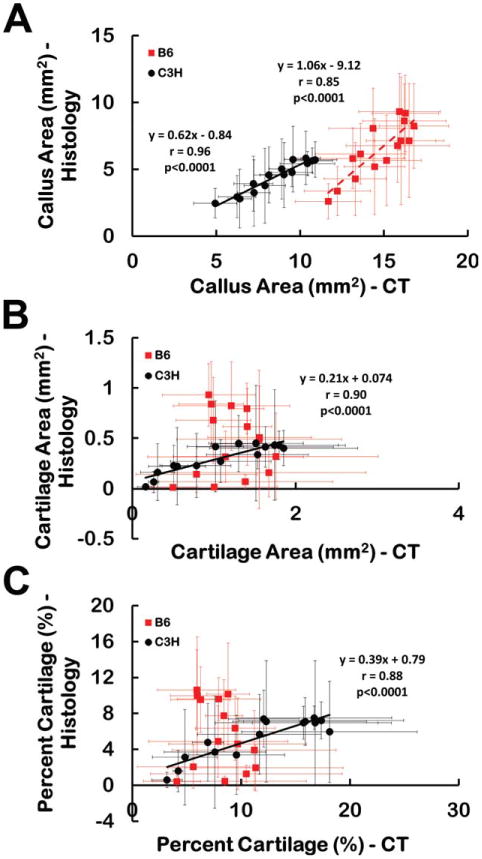
(A) Callus area, (B) cartilage area, and (C) percentage of the callus identified as cartilage as measured by CECT and histomorphometry at each location. Each data point corresponds to a particular location along the length of the callus, though the CECT and histomorphometry were performed on two different cohorts of specimens. The data point represents the mean, and the error bar one standard deviation. The areas of the callus measured by the two methods were strongly correlated for both strains. The areas of cartilage and percentage of cartilage measured by the two methods were strongly correlated for the C3H fracture calluses but were not correlated for the B6 fracture calluses. [Color figure can be viewed in the online issue, which is available at wileyonlinelibrary.com.]