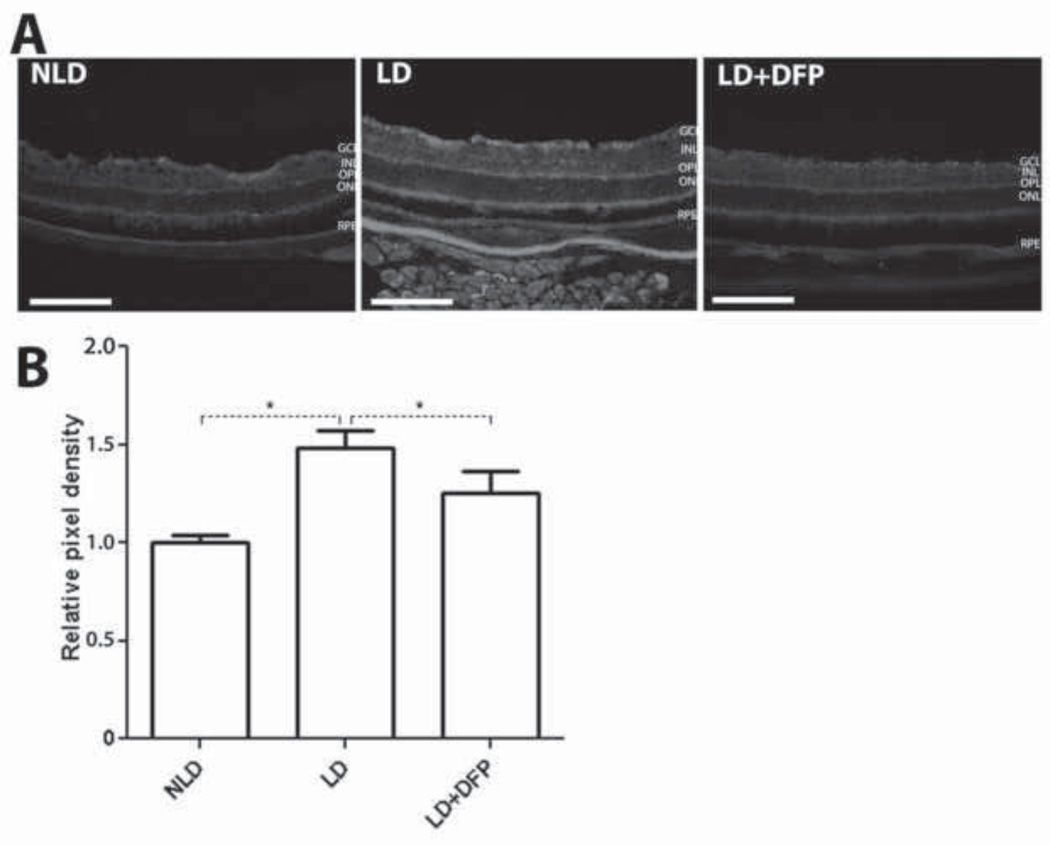
Fig. 5.
Comparison of nitrotyrosine levels in retina by immunolabeling and mean pixel density quantification. Monochromatic fluorescence photomicrographs of LD retinas showing stronger nitrotyrosine immunolabeling than DFP treated LD retinas (A). Immunoreactivity was quantified by measuring the mean pixel intensity within the whole retinas. The increased nitrotyrosine immunoreactivity induced by LD is significantly inhibited by DFP treatment (B). Scale bars=100µm. LD (n=3), LD+DFP (n=3) and NLD (n=3) retinas are displayed as mean values (±S.E.M). Significant difference (*P<0.05, **P<0.005).

