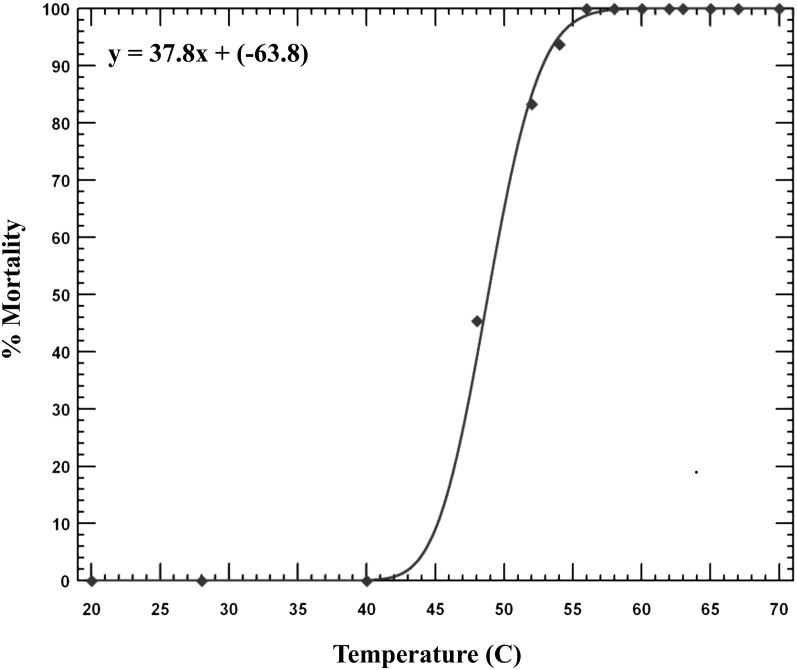
Fig. 2.
Modeling of the dose-response of small wood samples infested with Bursaphelenchus xylophilus and treated with microwave irradiation at 14 different temperatures with a one-min hold time. Each wood sample represented one observation. Each data point represents the percentage mortality at that temperature. The distribution was determined by best fit of the data. Probit model Chi-square Goodness of Fit test = 1.15, df = 12, heterogeneity (h) = 0.096 (h < 1 represents a good fit of the data).

