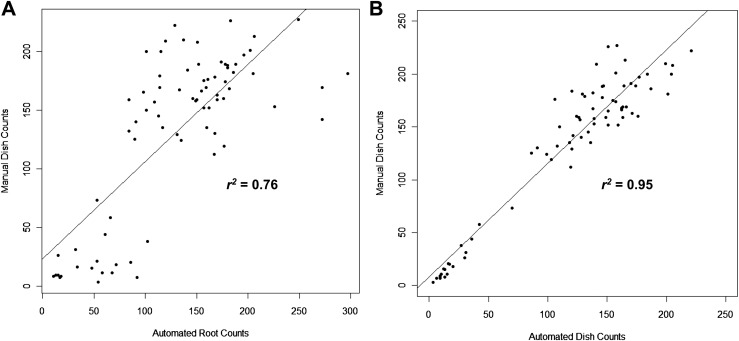
Fig. 2.
Scatter plots depicting the relationship between manual counts of SCN females in Petri dishes and automated SCN female counts directly on roots (A) or automated SCN female counts in Petri dishes (B). Each point corresponds to counts from an individual plant. Coefficients of determination (r2) are indicated.

