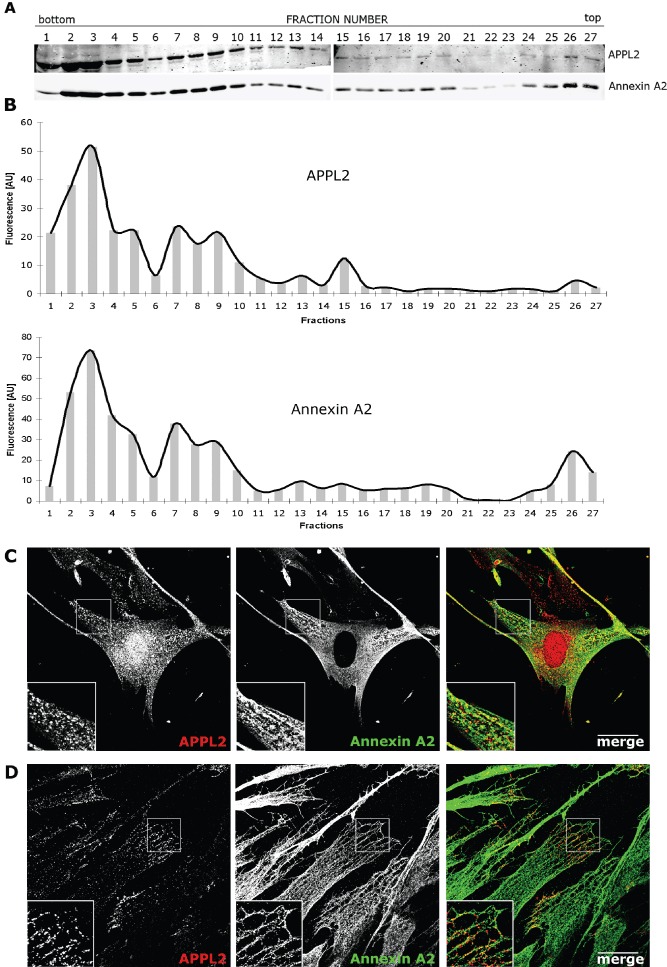
Figure 2. Annexin A2 and APPL2 show a highly similar migration pattern in a continuous OptiPrep gradient and colocalize with each other in cells.

A) PNS extracted from S-HeLa cells was adjusted to the final OptiPrep concentration, 40.6% (w/v), and underloaded at the bottom of a 5–20% (w/v) continuous OptiPrep gradient. After centrifugation, 27 fractions of equal volume (450 µL each) were collected, pelleted, resolved on the gradient (6–15%) SDS–PAGE and immunoblotted for APPL2 and Annexin A2. B) Western blot shown in A was subjected to densitometric analysis with Odyssey Infrared Imaging System. Fluorescence intensities of APPL2 and Annexin A2 bands in each fraction are expressed in arbitrary units (AU). C and D) Colocalization analysis of APPL2 and Annexin A2 in CCD-1070SK cells. In (C), cells were fixed, permeabilized and immunostained with antibodies against APPL2 (red) and Annexin A2 (HH7 clone; green). In (D), cells were initially permeabilized as described in Materials and Methods in order to wash away the cytoplasmic fraction of Annexin A2, then fixed and immunostained as in D. Single confocal sections are shown in (C) and (D). Scale bar, 20 µm.
