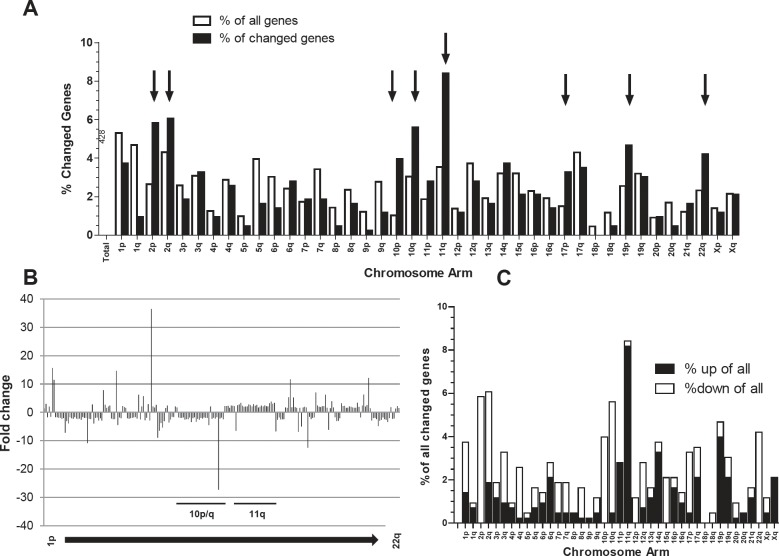
Figure 2. Differentially expressed genes (Student`s t-test, p<0.01; N=428 probes) in the “fast” versus the “slow” melanoma subgroups are not randomly distributed across the chromosomes.
(A) Percentage of all genes located at the indicated chromosome arms as compared to the percentage of changed genes are indicated by open and black bars, respectively. Chromosome arms with highly increased aberration ratios are indicated (black arrows). (B) Fold changes in the expression levels for the 428 probes in the fast- versus slow-growing subgroup are mapped to the respective chromosomal regions. (C) The percentage of genes significantly up- or downregulated in the fast- versus slow-growing melanoma subgroup at the indicated chromosomal arms were calculated.

