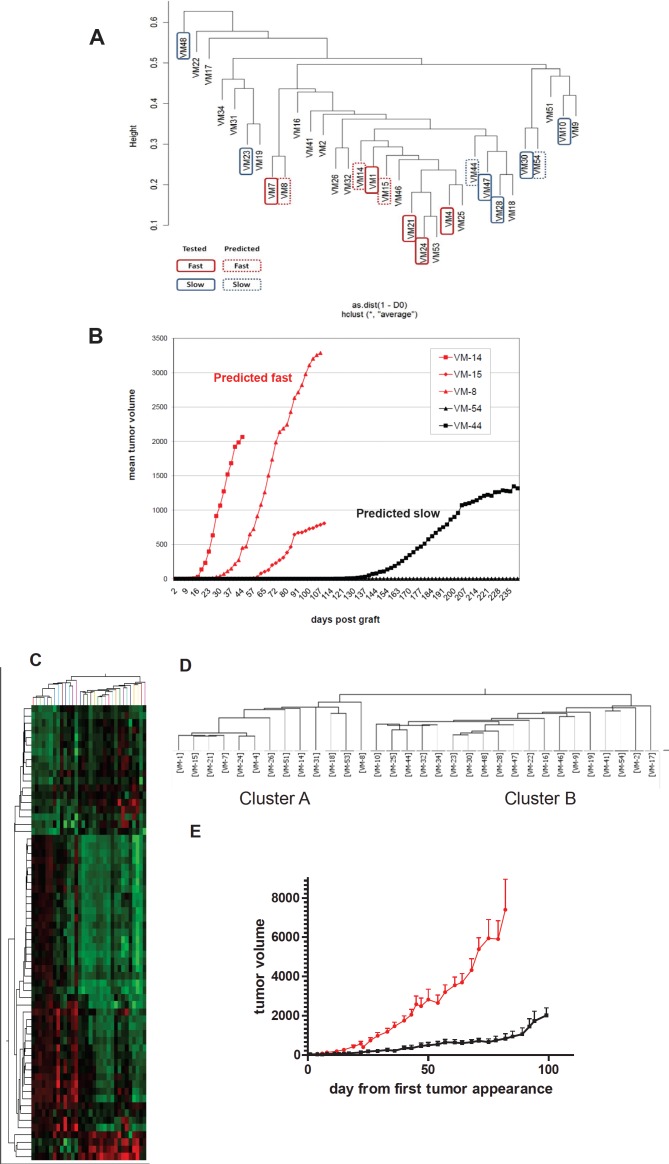
Figure 4. Genomic alterations allow prediction of local growth aggressiveness of human melanoma models in immuno-compromised mice.
(A) Unsupervised clustering of the original 11 (solid boxes; red and blue indicate fast- versus slow-growing, respectively) and the additional 21 melanoma cell models was performed based on array CGH data. Those melanoma models selected for validation in xenograft growth are indicated by dashed outlines. (B) Xenograft growth characteristics of the melanoma models selected for validation are shown. (C) Clustering of the 32 melanoma models by array CGH data based on probes (N=62; “genomic identifier”) differing at p<0.0005 (Student´s t-test) between the fast- versus the slow-growing subgroup of the original 11 melanoma cell models. The corresponding heatmap and dendrogram are shown. (D) Assignment of the melanoma cell models to the two clusters generated by the genomic identifier probe set. (E) Mean tumor growth from the day of measurable tumor detection of the 9 melanoma xenografts assigned to cluster A (red line) and the 12 xenografts to cluster B (black line) is shown.

