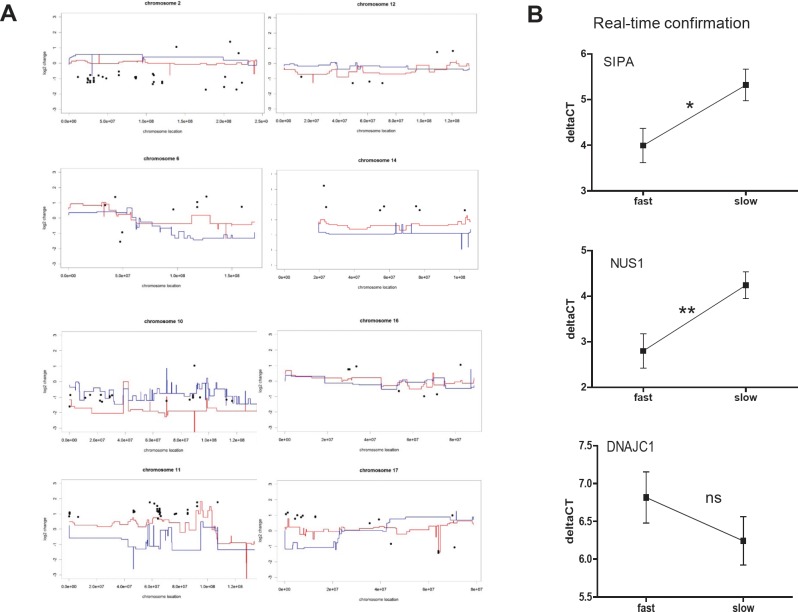
Figure 5. Aneuploidy-driven gene expression deregulation underlies aggressiveness of melanoma xenograft models.
(A) Genes (191 probes covering 180 genes) differing in mean expression values between the two melanoma subgroups at a significance level of p<0.005 (Student´s t-test, log2 of fold-change, black dots) are blotted for the most informative chromosomes against the mean array CGH aberration scores (log2) for fast- (red lines) and slow-growing (blue lines) melanoma cell models. Accordingly, a value of 1 indicates a two-fold increase and -1 a two-fold decrease in mean expression level in the fast- versus the slow-growing subcluster. In contrast, array CGH data indicate mean (log2) gains/losses in the two melanoma subgroups as compared to normal control DNA pooled from healthy donors. Consequently, a value of 1 indicates a two-fold increased copy number of the respective chromosomal region in the indicated melanoma subcluster. (B) Expression levels of three selected genes from Supplementary Table S2 were evaluated by real-time RT-PCR and mean deltaCT values in the fast- versus the slow-growing subclusters are shown.

