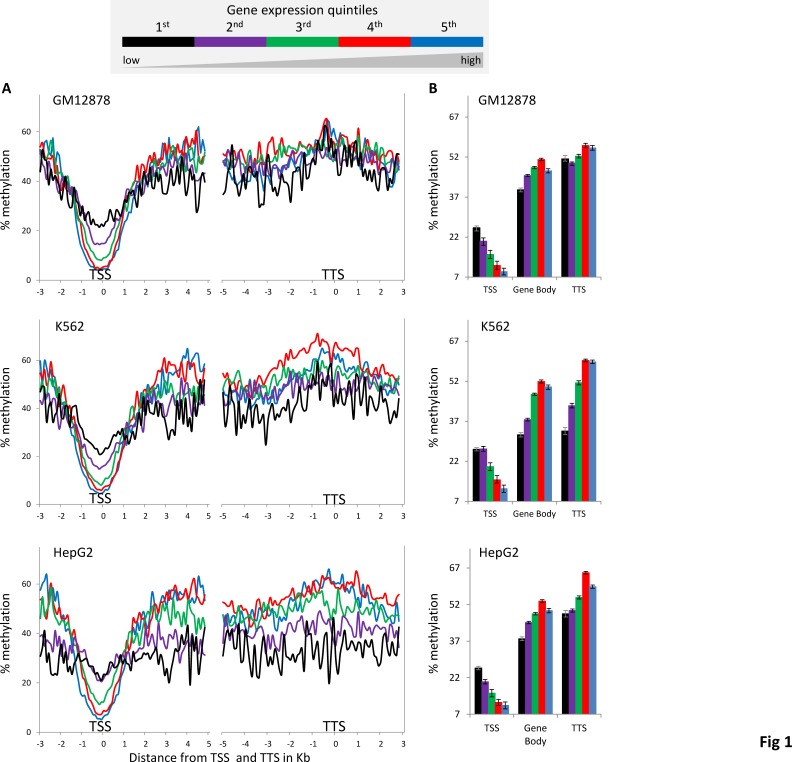
Figure 1. DNA methylation levels around the TSS, gene-body and TTS across five gene expression level bins.
(A) Average percentage methylation levels of 100bp windows spanning the TSS, gene-body and TTS, showing 3kb and 5kb upstream and downstream of TSS respectively and 5kb and 3kb upstream and downstream of TTS respectively. (B) Overall average (± standard error) percentage methylation levels for TTS, gene-body and TTS.

